


Distributed Inference Benchmarks: Kinference vs. Plain Kubernetes


November 4, 2026
Kinference (“kay-inference") is an inference control plane for Kubernetes and vLLM. Kinference sits in front of a heterogeneous set of GPUs and models, each with different capabilities and levels of performance; takes inference requests from a set of heterogeneous clients, each with different requirements and competing demands; and figures out how to satisfy the clients without overloading the cluster. And it gives you declarative policies to determine exactly how that happens.
Part of how Kinference delivers on its promise is by load balancing inference requests based on predicted TTFT. In other words, given an inference request (a “prompt”), Kinference predicts the time-to-first-token (TTFT) for that request against each candidate endpoint, then sends it to the worker (e.g. vLLM pod) with the lowest predicted latency. TTFT is a good metric for this because it’s independent of the output size, and because load balancing here can make a tremendous difference–sometimes multiple orders of magnitude.
To make these TTFT predictions, Kinference makes use of a variety of data about the underlying vLLM pods, including contents of their KV cache. The KV cache is where inference workers store intermediate results of the prefill phase of inference computation. These results may be reused on future requests–but only if they share a prefix. Since many inference requests share a substantial prefix (for example, successive turns in the same conversation), sending a request to a worker with a high KV cache overlap can save a tremendous amount of time.
In this benchmark, we attempt to quantify exactly how much Kinference’s intelligent load balancing helps, by comparing inference requests to a multi-pod vLLM deployment with Kinference against the same requests without Kinference.
Benchmarks
We look at two basic measures of distributed inference performance:
- Unloaded latency. When the system is under light load and nothing is queuing, is Kinference faster?
- Capacity. When the system is under heavy load, how much more capacity can Kinference provide while maintaining a given SLO?
Measuring unloaded latency demonstrates the value of KV-cache-aware load balancing in isolation, i.e. independent of queueing and other factors. Measuring capacity within an SLO, by contrast, demonstrates real-world performance: how does KV-cache-aware balancing improve a system’s overall ability to serve inference traffic?
Experimental setup
To test our metrics, we created an AWS cluster where we deployed two identical pools of vLLM 0.31.0, running the Qwen-3.8-27B-FP8 open weight model. Each pool comprised 3 vLLM pods, each running on its own L40S GPU. The two arms of our test were two OpenAI chat-completion HTTP endpoints: one from Kinference, pointing to the first vLLM pool, and one from the Kubernetes Service record pointing to the second vLLM pool.
Our null hypothesis was the two arms would perform the same. Our alternative hypothesis, of course, was that we would see lower latency from Kinference on workloads whose requests share prefixes. We chose the primary metric for this comparison up front: median TTFT on two workloads, shared-prefix and multiturn (described below). The actual benchmarking was done with GuideLLM 0.8.1, which we ran on its own node in the cluster.
There are a couple things worth noting about this setup:
- This is a relatively modern Qwen model, running as a dense checkpoint on relatively old GPUs. It’s slow: we’re reporting reqs/min, below, a far cry from our usual RPS fare with Linkerd. Similarly, our latency SLOs are relatively high–not appropriate for chat, but plausible for offline agentic workloads.
- Different models and different hardware will deliver very different results, so the raw numbers here are less important as they are specific to these choices. The comparative numbers are the important ones.
- For the service arm of our test, GuideLLM sent requests straight to the pool’s Kubernetes Service (ClusterIP). kube-proxy, in iptables mode, picks a random pod for each new connection, and GuideLLM opens a new connection for almost every request. Thus, the service arm saw requests distributed randomly across its three replicas.
Workloads
For the unloaded latency benchmark, we used open-loop Poisson arrivals at a low rate which we empirically determined would not saturate the vLLM workers. For the capacity benchmark, we used closed-loop traffic at a fixed concurrency, i.e. each client sent traffic as quickly as it could. For each condition and trial within these benchmarks, both arms received identical prompts, and in the latency benchmarks requests were sent at identical times. Prompts and prefixes were new in every condition and trial.
Finally, each benchmark covered three types of inference traffic: a control workload, a shared-prefix workload, and a multiturn workload:
We ran each workload with a 60 s warmup period and a 45 s cooldown period, and measured the results over 240 s. The rate column and these windows apply to the latency benchmark; the capacity benchmark used only shared-prefix and multiturn workloads at fixed concurrency (see Results and analysis: Capacity benchmark).
In total the latency benchmark had 3 workloads × 2 arms × 3 trials = 18 runs. The arms ran one after the other, and order alternated between conditions. A request was measured iff it started inside the measurement window.
Results and analysis: Unloaded latency benchmark
Summary: In the shared-prefix workload, Kinference cut median TTFT by 95% and median E2E latency by 45%. In the multiturn workload, Kinference cut median TTFT by about 65% and median E2E latency by about 32%, versus standard Kubernetes load balancing.
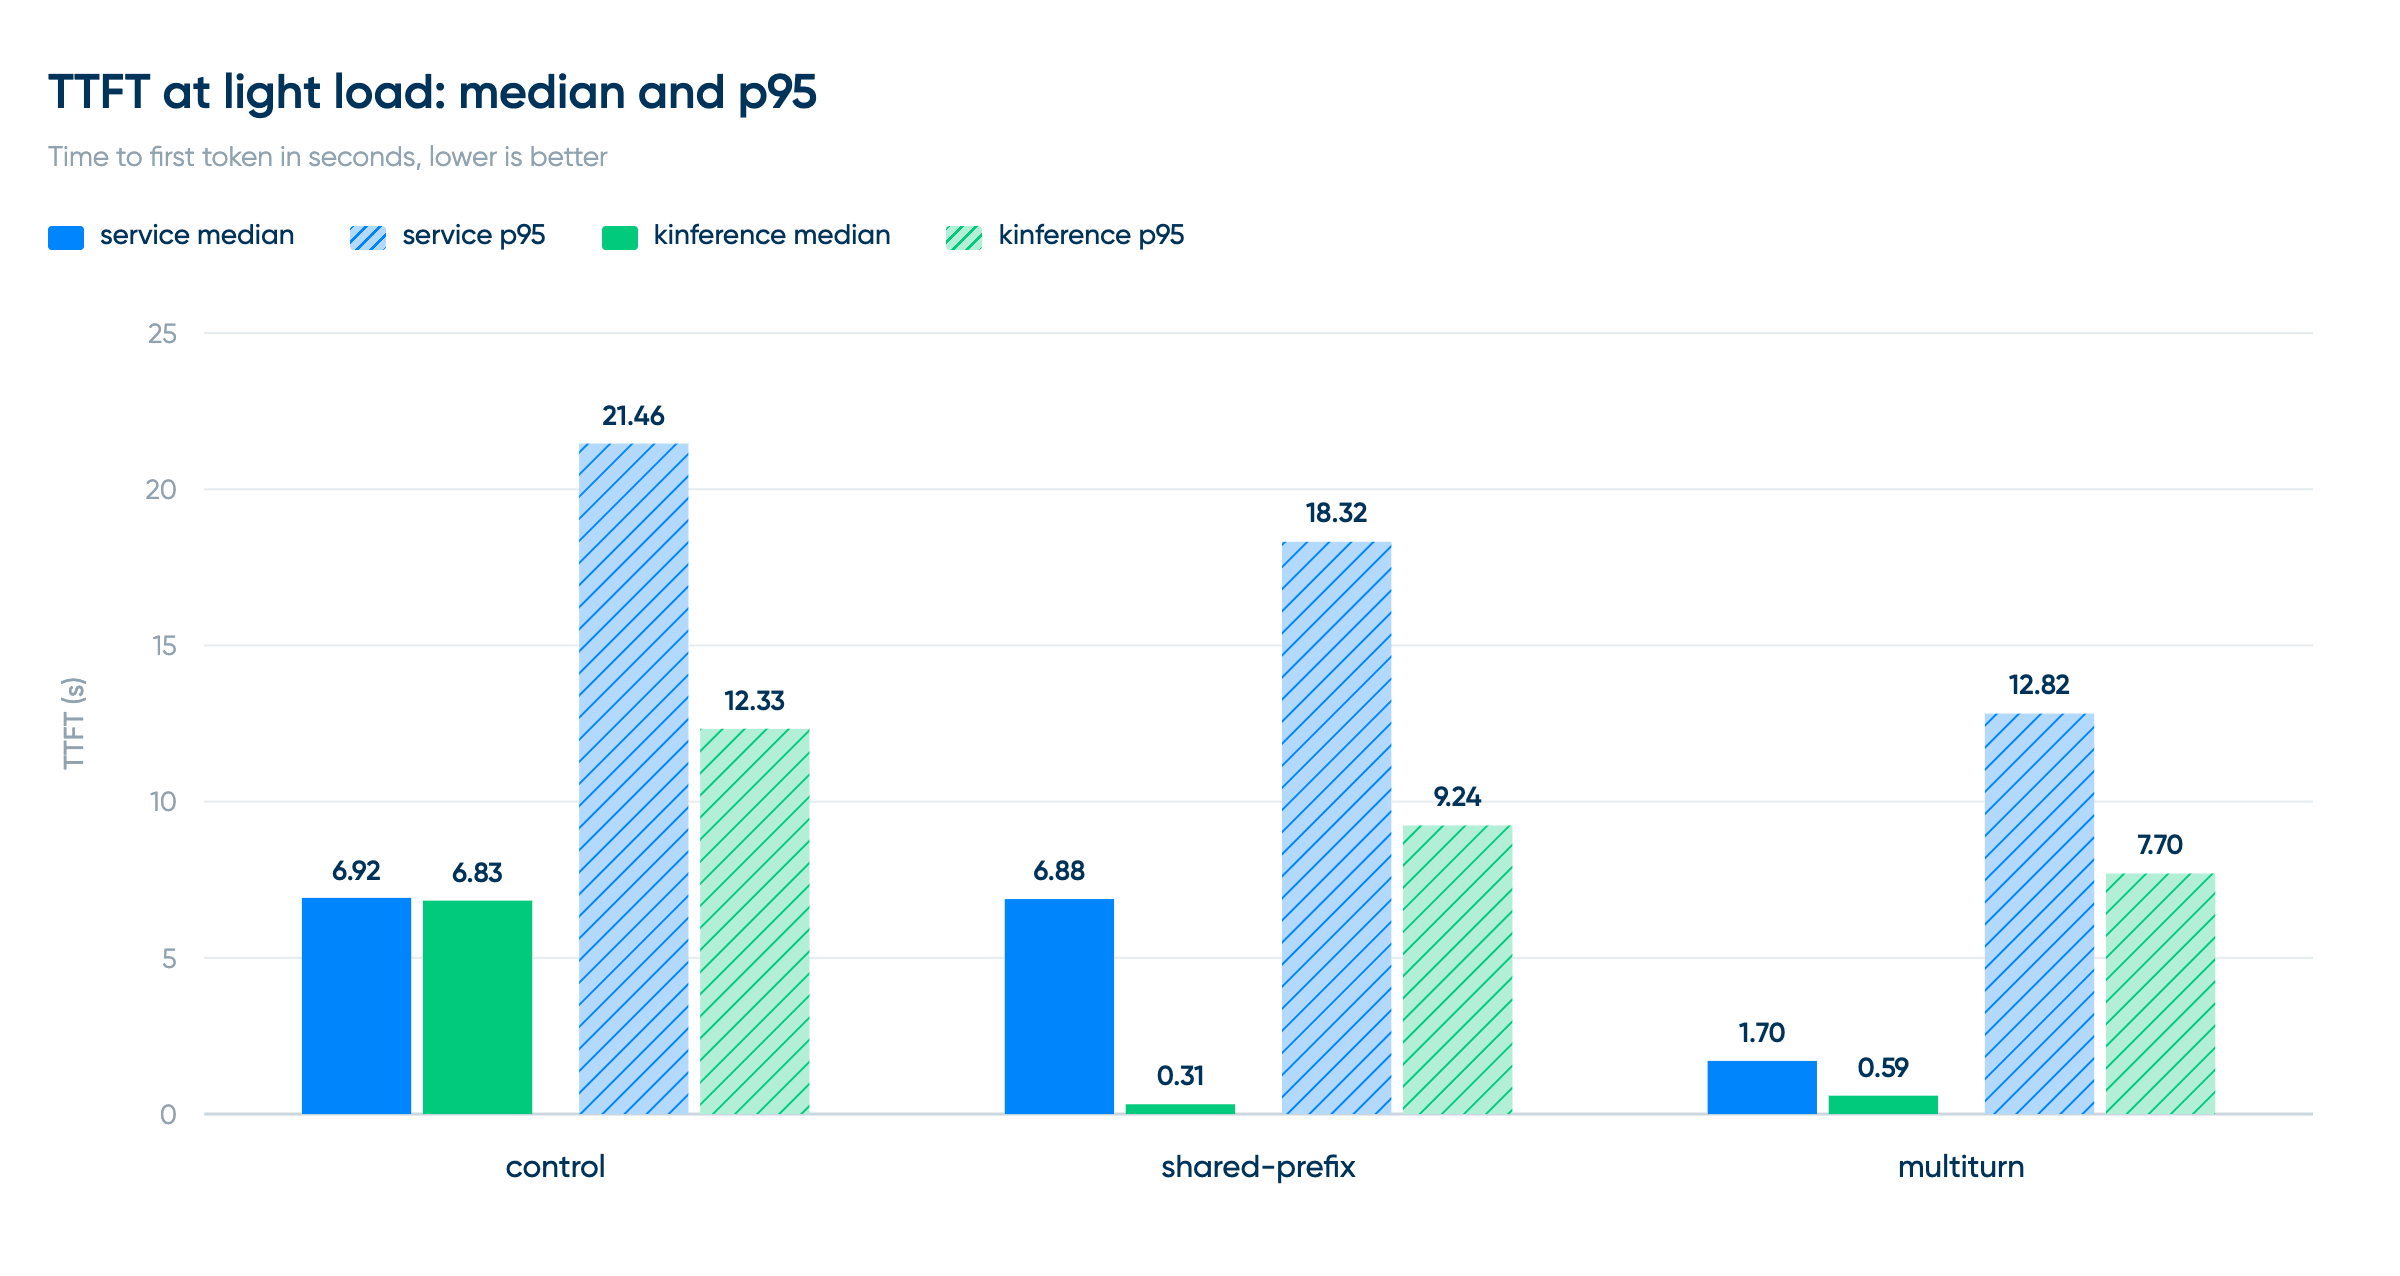
Primary metric: TTFT
(Confidence intervals are 95% CIs from a paired hierarchical bootstrap with 2,000 resamples.)
In our control conditions, median TTFT is indistinguishable between the arms (6.92 s vs 6.83 s). Without reusable prefixes, Kinference adds no measurable latency, and the two pools perform alike–as we expect. Interestingly, the control p95 is another matter: 21.5 s on the service arm vs 12.3 s with Kinference. This is likely due to Kinference’s usage of vLLM queue size as well as KV cache overlap to predict TTFT–even with prompts that share zero overlap, Kinference can still make intelligent balancing decisions and reduce tail latencies.
In our shared-prefix workload, Kinference cuts median TTFT by about 95% (6.88 s to 0.31 s) and p95 TTFT by about 50% (18.3 s to 9.2 s), a clear improvement over default Kubernetes load balancing.
In our multiturn workload, Kinference cuts median TTFT by about 65% (1.70 s to 0.59 s) and p95 TTFT by about 40% (12.8 s to 7.7 s)–also a clear improvement. Note that the gain here is smaller than on shared-prefix because the first turn of every conversation has nothing to reuse.
Secondary metrics: ITL, E2E latency
Turning to inter-token latency (ITL) and end-to-end (E2E) latency, we see a similar story. In our shared-prefix workload, Kinference cuts median end-to-end latency by about 45% (20.5 s to 11.3 s) and median ITL by about 4% (44 ms to 42 ms). In our multiturn workload, it cuts median end-to-end latency by about 32% (13.4 s to 9.1 s) and median ITL by about 10% (47 ms to 43 ms). On control, neither difference is significant; both CIs reach 1.
Most of the end-to-end gain comes from the shorter TTFT, which is a component of E2E latency. The rest comes from faster token generation: Kinference’s replicas recompute fewer uncached prefixes, so there is less work that competes with producing the remaining tokens.
Output throughput was about equal on every workload, with ratios of 0.98–1.05 per trial, as expected at a fixed arrival rate that both arms keep up with. No request failed or was left unfinished.
Results and analysis: Capacity benchmark
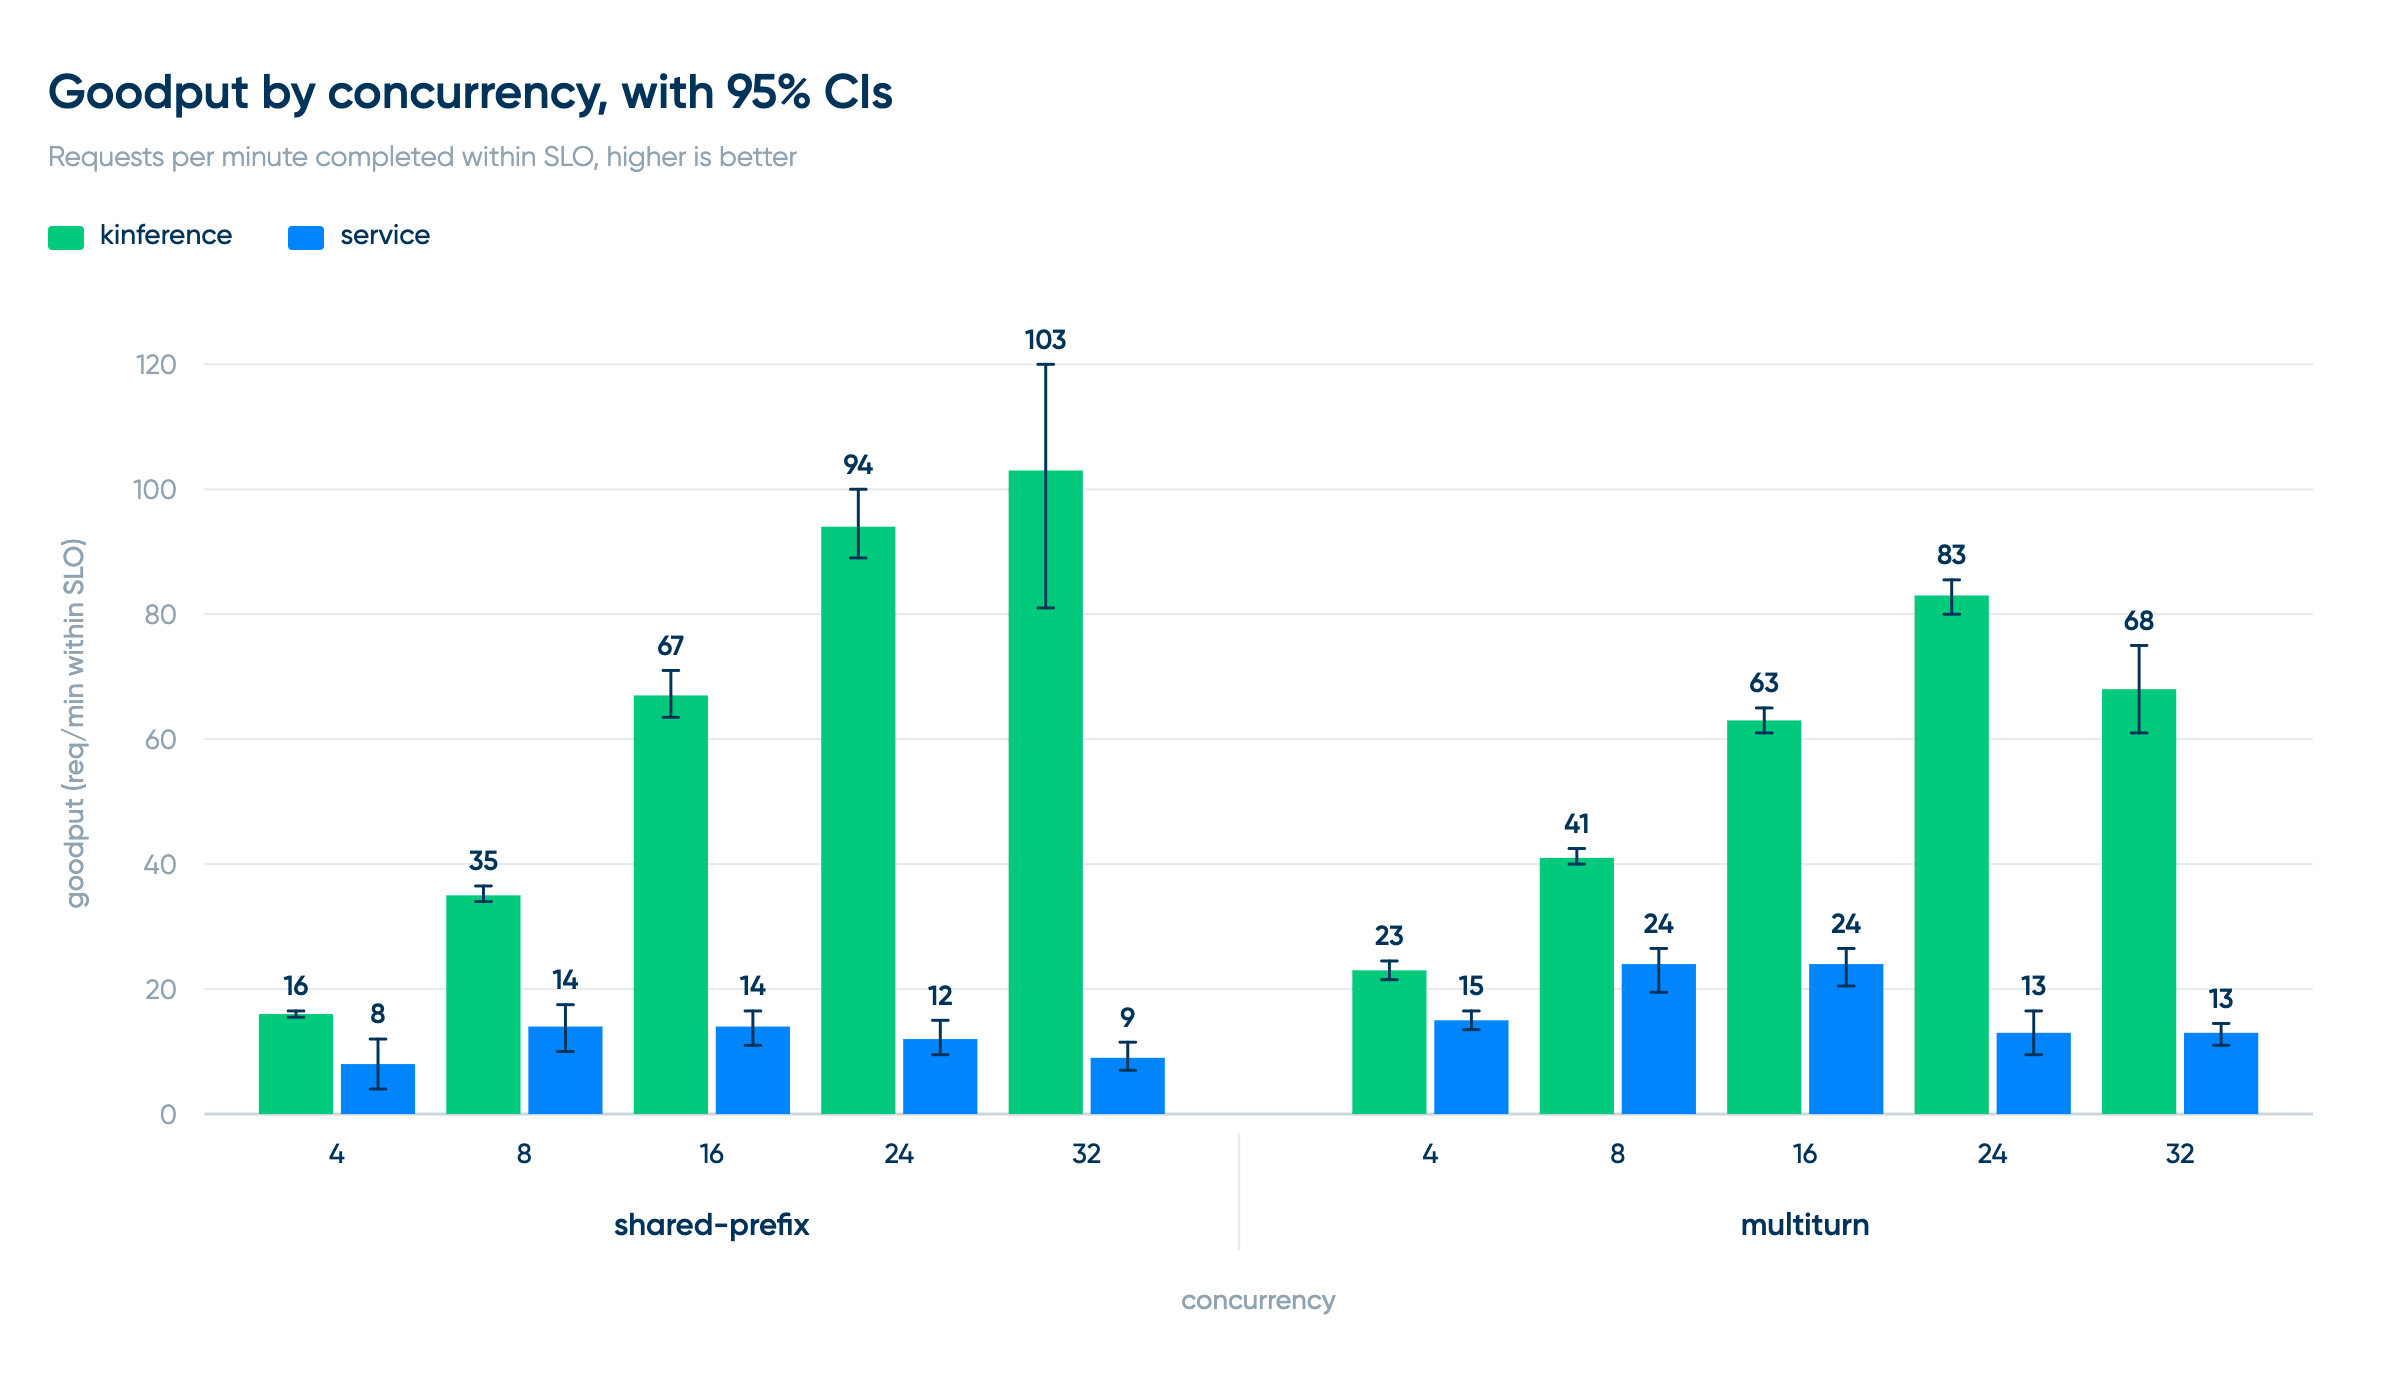
Summary: At peak, Kinference served about 7.4× the service arm’s goodput on shared-prefix and about 3.5× on multiturn. It was able to attain our chosen SLO at concurrency 32 (the highest measured) on our shared-prefix workload, and concurrency 8 on the multiturn workload, whereas the kube-proxy approach was not able to attain the SLO at any concurrency level.
In our unloaded latency benchmark, we sought to measure the effect of Kinference’s KV-cache-aware load balancing in isolation. In our capacity benchmark, we ask a different question: with N users, each sending its next request as soon as the last answer finishes, how many requests per minute can each endpoint serve within a latency SLO?
Our null hypothesis was that at each concurrency, the two endpoints would have the same goodput: the number of requests per minute that met the SLO. Our alternative hypothesis was that Kinference would have higher goodput, and would keep meeting the SLO at higher concurrency. As before, we chose the primary metric up front: the goodput difference (Kinference − service) at each concurrency.
Picking the SLO
What SLO do we use? Ideally, we’d pick one from first principles–for example, we might not want a user waiting on a live chat bot to have to wait more than 500ms for the first token. For this experiment, we instead opted to pick them empirically, so that we could measure comparative behavior against SLOs that would actually be attainable–an SLO that neither approach could attain on the model and hardware chosen would not make for a very interesting benchmark!
Thus, we set our SLOs based on the uncached TTFT measured on an idle deployment, plus some padding.
Note, again, that these SLOs are relatively high due to the specifics of the hardware and model combination we tested–unlikely to be viable for interactive chat, but perhaps viable for human-out-of-the-loop agentic flows.
Load
Unlike our unloaded latency benchmark, our capacity benchmark is a closed loop: at concurrency N, N requests are always in flight (for multiturn, N conversations of 8 turns each). This means a faster endpoint also receives more requests per minute.
We ran the shared-prefix and multiturn workloads at concurrencies of 4, 8, 16, 24 and 32, with three trials each and a 60 / 180 / 60 s warmup / measured / cooldown window: 2 workloads × 5 concurrencies × 2 arms × 3 trials = 60 runs.
The results are as follows.
Here, goodput and difference numbers are reported in requests per minute, and confidence intervals come from the same paired hierarchical bootstrap as in the latency benchmark.
Kinference had higher goodput at every concurrency on both workloads, and in every one of the 30 paired trials. The gap grows with load: on shared-prefix, Kinference’s goodput is 2.1× the service arm’s at concurrency 4 and about 7.5× at 24; on multiturn, 1.5× at 4 and about 6.4× at 24.
In fact, despite our methodology above, the service arm didn’t meet the SLO at any concurrency we tested. Its best attainment was 70% on shared-prefix and 76% on multiturn, both at concurrency 4. Kinference met the shared-prefix SLO at every concurrency up to 32, and the multiturn SLO up to 8 (at 16 and 24 it reached 87% and 89%, just short of the target).
Conclusion
In both unloaded latency and capacity benchmarks, Kinference outperformed standard Kubernetes load balancing by significant amounts:
- In the unloaded latency benchmark, Kinference cut median TTFT by 95% and median E2E latency by 45% on the shared-prefix workload, and cut median TTFT by 65% and median E2E latency by 32% on the multiturn workload.
- In the capacity benchmark, Kinference served 7.4× the goodput on shared-prefix and about 3.5× the goodput on multiturn. It was able to attain our chosen SLO at concurrency 32 (the highest measured) on our shared-prefix workload, and concurrency 8 on the multiturn workload, whereas the kube-proxy approach was not able to attain the SLO at any concurrency level.
We often think of load balancing as “nice to have”. For inference workloads that have shared prefixes (such as chat and coding sessions), and which are served from multiple replicas, KV-cache-aware load balancing is arguably essential. The difference can be enormous: we were able to demonstrate a 95% drop in TTFT in one experiment and an almost 7.5× capacity improvement in another.
Of course, intelligent load balancing is just one part of what Kinference provides, alongside inference policies, rate limiting, tenant tracking and cost estimation, and much more. Kinference is open source and you can install it on your Kubernetes cluster in seconds–check out the Kinference getting started guide and give it a whirl!
FAQ
How does KV-cache-aware load balancing work for LLM inference?
Kinference predicts time-to-first-token (TTFT) for each request against every vLLM pod, using KV cache contents and queue size, then routes it to the pod with the lowest prediction. Requests that share a prefix land where that prefix is already cached, unless that pod is already busy, then another GPU can be selected if it is predicted to respond faster.
How much does Kinference reduce TTFT compared to Kubernetes Service load balancing?
In our benchmark, Kinference cut median TTFT by 95% on a shared-prefix workload (6.88 s to 0.31 s) and by about 65% on a multiturn workload (1.70 s to 0.59 s), compared to a plain Kubernetes Service in front of the same 3 vLLM pods.
Does Kinference add latency when prompts don’t share a prefix?
No. On prompts with no shared prefix, median TTFT was 6.92 s through the Kubernetes Service and 6.83 s through Kinference. Kinference also cut p95 TTFT from 21.5 s to 12.3 s, likely because it factors in vLLM queue size as well as cache overlap.
How much more inference capacity does Kinference provide than kube-proxy under load?
At peak, Kinference served about 7.4× the goodput (requests per minute that met the service-level objective, or SLO) on shared-prefix traffic and about 3.5× on multiturn traffic. The plain Kubernetes Service didn’t meet the SLO at any concurrency we tested.
Why does default Kubernetes load balancing perform poorly for vLLM inference?
kube-proxy in iptables mode picks a random pod for each new connection, ignoring which pod already holds the request’s prefix in its KV cache. Pods without that prefix have to recompute the prefill, which adds latency and competes with token generation.


