Benchmarking gRPC Load Balancing on Kubernetes in 2026: Linkerd vs Istio vs Cilium



Ivan Porta
July 14, 2026
gRPC is a popular protocol for inter-service communication. However, when gRPC is used on Kubernetes, it exhibits a surprising problem: the default Kubernetes load balancer and the default gRPC client behavior combine to actually negate load balancing and route all traffic to a single pod! This unpleasant surprise is made worse by the fact that it manifests not as errors but as high-tail latencies that can crop up randomly and intensify when pods are under stress.
Almost eight years ago, we described this phenomenon in gRPC Load Balancing on Kubernetes without Tears and gave an easy solution: deploy Linkerd. Linkerd’s intelligent connection management and request-level load balancing ensure proper load balancing of gRPC traffic without requiring code changes (or even configuration).
Today, the challenges with gRPC on Kubernetes remain. But there are now several service meshes to choose from. For the purposes of handling gRPC traffic, are they equivalent? To find out, Buoyant's Escalation Engineering team ran 700 benchmark tests across 5 isolated EKS clusters, testing how vanilla Kubernetes, Cilium (L7), Istio Ambient, Istio Sidecar, and Linkerd each handle a single degraded backend pod under gRPC load. The test harness and raw results can be reviewed or replicated here. The results are stark:
Linkerd held its tail latency flat as a backend pod degraded, and under the most severe delay its p99 came in more than 8x lower than Cilium L7 or either Istio mode.
Why do L4 load balancers struggle to distribute gRPC traffic effectively?
Why is this a problem in the first place? It comes down to an interaction between Kubernetes’s default load balancer, which works at the TCP (L4) layer, and gRPC, which is built on top of HTTP/2.
L4 load balancers make routing decisions at connection time. That works well with HTTP/1.1. Clients open multiple connections to parallelize requests, which gives the load balancer multiple chances to distribute work across backends. If one connection lands on a slow pod, others land elsewhere.
gRPC runs over HTTP/2, which multiplexes all requests over a single long-lived connection. One connection is sufficient and optimal by design, so clients don't open more. An L4 load balancer picks a pod when the connection opens, and every request on that connection goes to that pod until the connection closes or drops.
The result: no load balancing.
The test setup
The benchmark used an identical gRPC echo application (unary request/response) deployed to 5 isolated EKS clusters, one per mesh, on Kubernetes 1.35. Each cluster ran 5 server pods of the echo Deployment, one per node across 5 m5.2xlarge nodes (8 vCPU / 32 GiB, Guaranteed QoS, single AZ), with a dedicated m5.2xlarge load-generator node so the client never competed with the servers for CPU. 4 pods were healthy, and 1 had a delay injected via an in-app timer. Sleep controlled by ARTIFICIAL_DELAY_MS.
The target was a single Kubernetes ClusterIP Service backed by all 5 pods. The load generator resolved one Service address for every request, so on each request the networking layer in front of the pods (kube-proxy, Cilium's eBPF datapath, Istio's ztunnel, or the mesh's L7 proxy) chose which of the 5 endpoints would serve it. That choice is the entire experiment: a connection-level (L4) balancer makes it once when the connection opens and pins every subsequent request to that pod; a request-level (L7) balancer makes it fresh for each request.
We drove load with ghz, a dedicated gRPC benchmarking tool. Each run opened one connection (-C 1) carrying 200 concurrent in-flight streams (-Q 200) and ran continuously for 300 seconds (-d 300s) after a discarded 15-second warm-up. 200 is the concurrency level, the number of streams kept in flight at once, separate from the total request count. With one connection driving 200 streams for 300 seconds, each run completes roughly 0.3 to 4.7 million requests (the fast conditions land near the top of that range, and a self-throttled slow-pinned connection sits near the bottom), so every reported percentile is computed over hundreds of thousands of requests. Each scenario was repeated 20 times, producing 700 total runs and over 2.5 billion requests. Error rates stayed well under 0.01% across all conditions, consistent with end-of-window HTTP/2 stream cancellations.
Why ghz? We evaluated k6 and the gRPC test-infra tooling first. ghz won on the one axis this study turns on: explicit, independent control over connection count (-C) and per-connection concurrency (-Q), which is exactly the variable that separates L4 from L7 behavior for gRPC. k6's gRPC support didn't give us the same low-level control over connection reuse, and the gRPC test-infra harness is built for the gRPC project's own cross-language performance suite rather than ad-hoc mesh comparisons. (See Limitations below for two known ghz measurement caveats, a per-run sampling cap and coordinated omission.)
The conditions tested:
To keep the comparison fair, each data-path proxy was pinned to the same Envoy/Linkerd worker count (concurrency/cores = 2) with an explicit CPU/memory budget, so no mesh wins or loses on thread count. One asymmetry remains, and we flag it throughout: Cilium's per-node Envoy is allowed a higher CPU ceiling (cpu: 2) than the per-pod sidecars (cpu: 500m). If anything, this favors the Envoy meshes.
A note on configuration effort
The meshes were not equally easy to bring to their best showing, and that effort is itself part of the comparison. To give every mesh a fair shot, we deliberately invested more setup, research, and validation in others than in Linkerd.
- Cilium L7 took the most work. Request-level routing isn't on by default. Turning it on required replacing
kube-proxywith the eBPF datapath, enabling Envoy’s L7 mode, applying aCiliumEnvoyConfig, and annotating the Service with service.cilium.io/lb-l7=enabled in a specific order, since Cilium’s init path depends on thekube-proxystill being present at install time. - The Envoy-based meshes needed deliberate tuning to be measured fairly. Reaching a defensible baseline for Cilium L7 and Istio Sidecar, rather than a hobbled one, meant fixing worker concurrency, setting CPU/memory budgets, and selecting the
LEAST_REQUESTpolicy, plus extra validation that each was actually load-balancing as intended. - Linkerd required no load-balancing configuration. EWMA request-level balancing is its default, so there was no policy to select and no separate L7 datapath to assemble. We used BEL (Buoyant Enterprise for Linkerd) for this benchmark comparison, however Linkerd open source uses the same underpinnings, so performance results should be similar, if not identical. (You are welcome to replicate the testing using Linkerd open source, and give us feedback in the Linkerd Slack community!)
One note on scope
A note on what we're testing. This study is about request-level (L7) load balancing for gRPC. Several of these meshes are L4 by default with L7 as an add-on: Cilium runs an eBPF L4 datapath with an optional Envoy L7 layer, and Istio ambient runs ztunnel at L4 with an optional waypoint at L7. We deliberately enabled the L7 path for each, so we're comparing like with like. Their default L4 modes behave like vanilla for a single gRPC connection, which is why we don't run them as separate columns.
Cilium's default eBPF (L4) mode is not run separately. With a single gRPC connection, it pins to one pod exactly like kube-proxy, so vanilla already represents the connection-level/L4 baseline. Adding a standalone Cilium L4 column would just reproduce the vanilla numbers.
Istio Ambient is a layered data plane. Its base layer, ztunnel, is L4. It handles mTLS and connection-level routing for every pod, and on its own it pins a single gRPC connection to one pod, just like vanilla. Request-level (L7) routing is an optional layer you add by deploying a waypoint proxy. Because this study is about L7 load balancing, we ran ambient with a waypoint in the path. For service-addressed (ClusterIP) traffic that means enrolling the namespace in the ambient dataplane (istio.io/dataplane-mode=ambient) and binding the Service to the waypoint (istio.io/use-waypoint). Without that binding the waypoint stays off-path and ambient behaves as L4, indistinguishable from vanilla for a single connection (see Istio #56864). The numbers here are with the waypoint in path and its Envoy set to LEAST_REQUEST, so they reflect genuine per-request load balancing.
gRPC tail latency spikes even with healthy pods
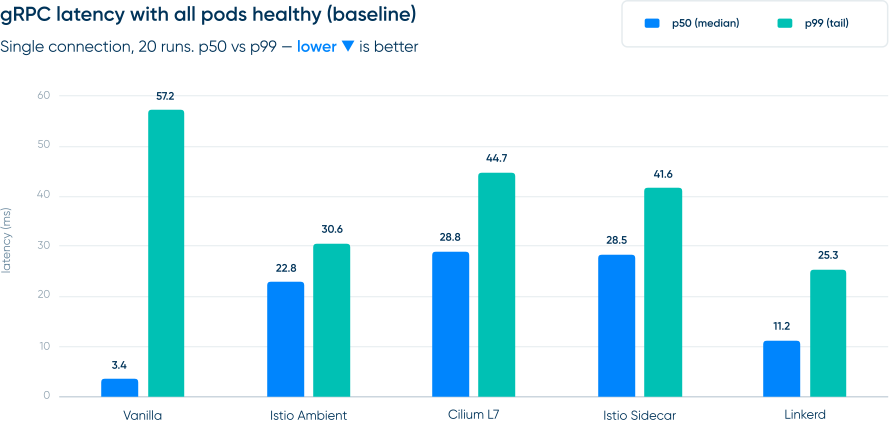
Before introducing any degraded pod, the baseline run with all pods healthy shows the issue:
Vanilla's p50 of 3.4ms looks excellent, but its p99 of 57ms is already 17x its own median, and no pod has degraded yet. Two things stack to produce that gap. With a single HTTP/2 connection every request is pinned to one of the 5 pods, so all 200 concurrent streams pile onto a single backend, and uneven request durations make some requests queue behind longer-running ones (head-of-line blocking). The tail pays the price. This also means vanilla's all-healthy baseline is really single-pod-under-load, not pure mesh overhead, so read the absolute millisecond gaps as directional, not exact.
The request-level meshes trade median latency for a tighter, more predictable distribution. Linkerd's p50 is 11ms, about 8ms of proxy overhead, but its p99 of 25ms is the tightest tail of any condition in the test, less than half of vanilla's 57ms. Istio Ambient and Istio Sidecar route per request too, at higher medians (23ms and 28ms) and wider tails (31ms and 42ms). Whether that median trade-off is worth it is exactly what the degraded-pod tests answer.
How does a single degraded pod affect overall gRPC latency on Kubernetes?
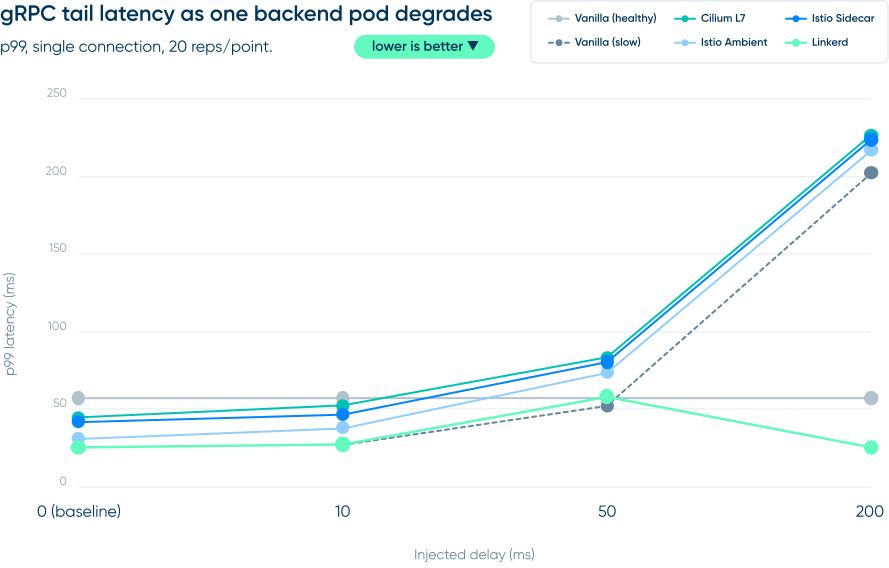

The primary test injected a 50ms delay into one of the 5 backend pods. The connection-level (L4) result is a coin flip with two outcomes. With one connection per run, every stream is pinned to whatever pod that connection lands on, so a run goes one of two ways: healthy-pinned (near baseline) or slow-pinned (every request eats the delay), with nothing in between. We report those two outcomes separately rather than averaging them, which would describe no actual run.
Vanilla is the only connection-level condition here, so we split its 20 runs by outcome. The request-level (L7) conditions don't have two outcomes. They route per request, so every run behaves the same and we report it directly.
This is the whole story of L4 and gRPC. A connection that lands on a healthy pod sees about 3.4ms, while a connection that lands on the slow pod sees about 51ms on every request for the life of that connection, a 15x hit to the typical request. There's no average experience that splits the difference. Which one you get is decided when the connection opens. In this run 3 of 20 vanilla connections landed slow-pinned, and across all the degraded conditions the slow-pinned share tracks the expected 1 in 5 (1 degraded pod of 5), with no platform signal and no recovery until the connection drops. The slow-pinned p99 of 52ms is actually lower than the healthy-pinned p99 of 57ms, because the slow pod adds a flat, low-variance 50ms while the healthy path's tail is dominated by head-of-line spikes. The coin-flip harm shows up as the median hit, while the tail stays flat.
The request-level conditions don't flip a coin. All of them route correctly, every run alike. At this mild 50ms delay Linkerd already posts the lowest tail (p99 58ms) and the highest throughput, 10.8ms p50 at 14,469 RPS against Istio Ambient's 8,028, Istio Sidecar's 6,685, and Cilium L7's 6,374. Istio Ambient, Istio Sidecar, and Cilium L7 sit at 74ms, 81ms, and 84ms p99. The picture separates much more sharply as the slow pod gets worse, which is the next section.
Adding more connections won't solve your gRPC load balancing issues
A common workaround for the L4 problem is to open multiple connections, giving the connection-level (L4) balancer more independent chances to spread work across backends. The mitigation test checked whether that actually fixes the tail (still at 50ms delay):
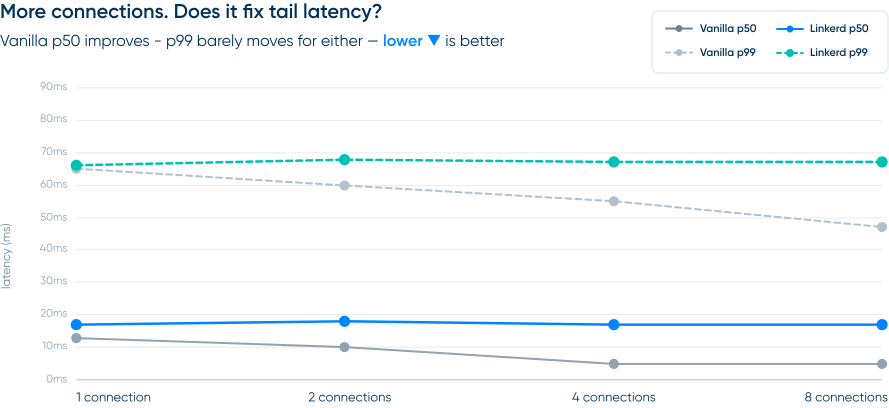
More connections do improve vanilla's typical latency, with the median p50 dropping from about 3.4ms to about 1.7ms, because with 8 connections any single connection landing on the slow pod taints a smaller fraction of the traffic. But the tail doesn't recover. It drifts the wrong way, from about 57ms to roughly 97ms, because with more connections more runs now have at least one stream pinned to the slow pod, so the slow-pod latency leaks into more of them. You can statistically dilute the bad pod in the median, but you have no recourse when you hit it, and the tail never improves. Linkerd's p99 stays flat near 58ms across every connection count, with no application changes.
Why EWMA outperforms LEAST_REQUEST
The request-level conditions route correctly, every run alike, with no slow-pinned outcome. The difference between them is the balancing algorithm, and it only becomes decisive as the slow pod gets worse. Cilium L7 and both Istio modes use Envoy with LEAST_REQUEST; Linkerd uses its own EWMA balancer.
Envoy's LEAST_REQUEST, used by Cilium L7 and both Istio modes, is concurrency-weighted. It routes to the pod with the fewest in-flight requests, so to notice a slow pod it has to accumulate requests and watch congestion build. It reacts to congestion that's already formed rather than steering away from a pod that responds slowly once. It can avoid the slow pod but never evicts it, so a roughly constant sliver of traffic keeps landing there. At 200ms of injected delay that sliver fills the tail. Istio Sidecar's p99 reaches 224ms and Istio Ambient's 217ms, both higher than the slow-pinned L4 runs at 203ms. The p99 is exactly the statistic that surfaces the ~1% of requests still hitting the 200ms pod.
Linkerd uses the exponentially weighted moving average (EWMA) of endpoint latency to make load balancing decisions. Slow endpoints are never evicted entirely, they are simply deprioritized based on observed latency. Each endpoint carries a cost estimate, corresponding to its recent peak latency times its in-flight request count, and Linkerd uses these costs to pick the best endpoint to deliver traffic to. A slow pod’s cost is high, so after the first request it will rarely get picked until its estimate decays to the point where it undercuts a fast pod. This explains Linkerd’s better tail latencies at the 200ms condition vs the 50ms one: At 50ms, the slow pod still draws more than 1% of requests, so the slow requests land in the p99 region. When the pod delay is 200ms, however, the cost takes longer to decay back, and the slow pod’s share of traffic drops below 1%. Now the slowed requests fall out of the p99 entirely.
The result is a clean crossover. At mild delay the request-level meshes are within about 20ms of each other, with Linkerd already lowest at 58ms. At severe delay they diverge hard.
As the slow pod gets worse, Linkerd's tail gets better, collapsing back to its healthy baseline of 25ms, while both Istio modes blow up to around 220ms, roughly 9x higher. That's the property that matters in production: the worse a backend degrades, the harder EWMA routes around it.
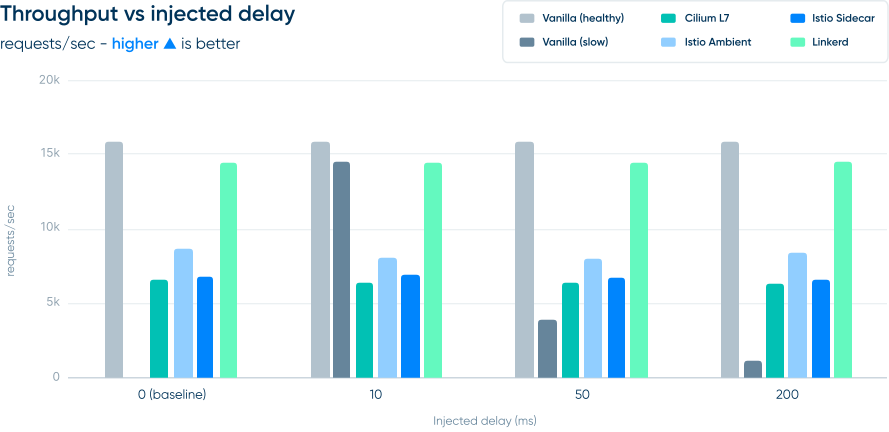
The throughput picture reinforces it:
At delay_200ms Linkerd delivers 14,521 RPS, roughly 1.8x Istio Ambient's 8,213 and about 2.2x the ~6,300–6,500 RPS that Istio Sidecar (6,542) and Cilium L7 (6,327) sustain. Istio Sidecar's bottleneck is architectural. All egress funnels through one per-pod client Envoy, which is the real source of both its low throughput and its ~28ms baseline median, and under multiple connections that sidecar even starts to hit CPU throttling. Cilium L7 lands in the same range on its per-node Envoy.
What this costs to run. Throughput is infrastructure cost in disguise. The fewer requests each pod serves, the more pods you provision for the same load. Vanilla is the cheapest to operate, with no proxy and about 15,800 RPS, but that low cost buys you the coin flip, since it can't route around a degraded pod. Among the options that route per request, Linkerd sustains by far the highest throughput at around 14,500 RPS, roughly 2x Istio Sidecar and 1.8x Istio Ambient. We also measured server-side proxy CPU directly. Linkerd's proxy burned about 3.2 cores (0.22 cores per 1,000 RPS) at 45 MiB with zero CPU throttling; the Istio Sidecar proxy ran about 1.9 cores (0.28 cores per 1,000 RPS) at 273 MiB and throttled under multi-connection load; the Istio Ambient waypoint ran about 1 core (0.12 cores per 1,000 RPS) at 226 MiB. The waypoint looks cheapest per 1,000 RPS, but that figure covers only its L7 leg. Ambient's ztunnel handles L4 and mTLS for every pod and we didn't capture its CPU this run, so ambient's true proxy cost is higher than the waypoint number alone. Cilium's L7 Envoy runs as a per-node daemon shared by every pod on the node rather than a per-pod proxy, so its CPU doesn't map cleanly onto a per-workload cores-per-1,000-RPS figure and we don't report one for it.
The scorecard: every condition, every axis that matters
¹ Vanilla is the connection-level (L4) condition. Its tail under failure isn't a single number: about 80% of connections behave near baseline, and about 20% pin to the slow pod and see its full latency on every request. Cilium's default eBPF mode behaves the same way for single-connection gRPC, which is why we don't run it as a separate row.
Vanilla keeps overhead near zero but can't route around a slow pod, so a share of connections collapse the moment one degrades, 1 in 5 here because 1 pod of 5 was slow. Cilium L7 and both Istio modes route correctly, but their tails blow up at severe delay and they pay in throughput. Linkerd is the only row that's green all the way across. It has request-level routing, the only tail that stays bounded as the pod worsens, the highest throughput of any mesh that routes correctly, and the lowest median overhead.
Limitations and how we report the numbers
For each run ghz computes a percentile distribution; we report the median of the per-run percentiles with the run-to-run range across the 20 reps, and for the connection-level conditions under load, we split the runs into their two real outcomes (healthy-pinned vs slow-pinned) rather than averaging them.
Latency window cap. ghz caps per-request tracking at 1,000,000 requests per run, so the latency percentiles reflect the first ~1M requests of each run, roughly the first 125–155s of the fast meshes' 300s runs (and nearly the full run for the slower Istio Sidecar). Throughput (RPS) covers the full 300s. The workload reaches steady state within the first ~15s, so this window is representative, but it is a known sampling bound.
Coordinated omission. We ran ghz closed-loop, so we did not account for coordinated omission. An open-loop rerun is planned follow-up and would, if anything, widen the L4-vs-L7 gap.
Which service mesh provides the best gRPC performance at scale?
If you're running gRPC on vanilla Kubernetes, Cilium's default eBPF mode, or Istio Ambient without an in-path waypoint, you have connection-level load balancing. When a pod degrades, the connections already pinned to it stay pinned — there's no request-level recovery until the connection drops. The share of traffic that gets stuck is the degraded pod's share of the endpoint pool: in our five-backend test, that was a fifth.
The fix is request-level load balancing, and that needs an L7 proxy in the data path. In this benchmark Linkerd, Istio Sidecar, and the Istio Ambient waypoint all provide it, but they aren't equivalent.
- Cilium L7 routes correctly and has a tight baseline tail (45ms p99), but it shares Envoy's LEAST_REQUEST weakness. Its p99 collapses from 84ms at delay_50 to 227ms at delay_200, it adds about 25ms of median overhead, and it sustains only around 6,400 RPS, among the lowest of the request-level meshes and measured on a per-node Envoy with fewer worker threads than the others.
- Istio Sidecar routes correctly but has the worst tail in the field (81ms → 224ms), the lowest throughput (~6,700 RPS), and the highest median overhead (~28ms), because all egress funnels through one CPU-capped client sidecar that even throttles under multiple connections.
Istio Ambient's waypoint routes correctly with a lighter CPU footprint, but it shares Envoy's LEAST_REQUEST weakness. Its tail blows up the same way under severe delay (74ms → 217ms), and its throughput (~8,200 RPS) trails Linkerd's by nearly 2x. Its per-1,000-RPS proxy CPU looks low, but that excludes the ztunnel L4 leg it also runs.
- Linkerd routes correctly with EWMA, adds only about 8ms of median overhead, sustains the highest throughput (~14,500 RPS), and is the only option whose tail stays at its healthy baseline as the pod degrades (25ms p99 at delay_200, versus roughly 9x that for the Istio meshes).
If you run gRPC at scale, the conclusion is clear: deploying Linkerd provides better performance in multiple scenarios as described in the tests above. It's the only configuration in this benchmark that eliminates the coin flip and keeps its tail bound under severe failure without making you pay for it in latency or compute.
Don't take our word for it. The entire test harness and raw results are at github.com/BuoyantIO/grpc-mesh-benchmark. Run it against your own workload and watch the tail. Get started with Buoyant Enterprise for Linkerd at https://enterprise.buoyant.io/.