 LinkedIn


See What Your Mesh Is Telling You: A Practitioner's Guide to Buoyant Cloud

.webp)
Joe Fuller
May 6, 2026
When it comes to observability, Linkerd already does the hard part. Every meshed pod runs a proxy that's measuring success rates, recording latencies, enforcing mTLS, and emitting a steady stream of golden metrics. By the time a request crosses a mesh boundary, your service has already produced more telemetry about its own health than most production systems generate in a week.
The problem isn't generating the signals. It's making sense of them at scale. Inside a single cluster, linkerd viz is enough to see most of it. But run Linkerd in five clusters, and the signal is split five ways. Run it in fifty, and the signal is no longer something you can hold in your head. It's a haystack with the needles already pre-distributed for you.
This blog post is a practitioner's tour: what it is, how it works, what you'll actually see, and a checklist for getting it right the first time.
What actually is Buoyant Cloud?
Buoyant Cloud is the dashboard, monitoring, and alerting platform for Buoyant Enterprise for Linkerd (BEL). It runs as a SaaS product, with a small agent deployed alongside BEL inside each of your clusters. The agent pushes mesh telemetry up to the platform, and the platform stitches it into a single view across your entire estate.
It doesn't replace anything in Linkerd. The control plane still runs in your cluster. Your proxies still talk to each other directly. Your traffic doesn't take a detour through the cloud. Buoyant Cloud sits one layer up: it watches what Linkerd is already doing, continuously assesses health, surfaces problems before they escalate, and gives you one screen instead of N.
If you're running a single small cluster, you may not need it. If you're running BEL in production across more than one cluster or are planning to, it's the difference between flying with instruments and flying by the seat of your pants.
Watch our Service Mesh Academy recording and/or read on!
Telemetry collection: Push-only agent for data privacy guarantees
The agent is push-only. It opens an outbound connection to Buoyant Cloud and sends data; the platform never connects back into your cluster. There's no inbound port to expose, no firewall rule to argue with your security team about. If your cluster can reach Buoyant Cloud's endpoints on 443, you're done.
It deploys via its own Helm chart, separate from BEL. This matters operationally, since the agent has its own release cadence and its own values file, and you can upgrade it independently of the mesh. The chart lives at artifacthub.io/packages/helm/linkerd-buoyant.
The footprint is small. The agent pod is a single deployment with configurable resource requests and limits, and you'll barely see it in your usage graphs.
The more interesting question is what the agent collects – and what it doesn’t collect. (This is the section you’ll want to forward to your security team about why it’s OK to run the agent!)
What the agent collects:
- Metadata about your Kubernetes workloads (Deployments, StatefulSets, DaemonSets) and your Linkerd CRDs (Servers, ServerAuthorizations, Multicluster resources, and so on).
- Proxy metrics about application traffic: success rates, latency percentiles, request volumes.
- The public half of proxy mTLS keys, used for identity verification.
What the agent never collects:
- Application traffic contents. Not request bodies, not response bodies, not headers.
- Private keys. Ever.
- Application payloads of any kind.
If you've ever had to defend an observability tool's data-handling story to your security team, this is the section you'll want to forward.
Deploying the agent: Prerequisites and Helm installation
Prerequisites are short: a BEL Strategic Plan, Linkerd already installed in the cluster, and Helm.
The flow is straightforward. Log in to the Buoyant Cloud dashboard, go to the Clusters page, and create a new cluster entry. The dashboard generates a client ID, a client secret, and a values file pre-populated with the right configuration. Set the CLUSTER_NAME variable, and pick that name carefully, because it persists everywhere in the dashboard for the lifetime of the cluster. We'll come back to naming in the checklist.

helm install and you're done. The agent comes up, registers, and starts pushing data within a couple of minutes.
.webp)
If you run network policies, you need an egress rule allowing the agent pod to reach Buoyant Cloud. Upgrades are a helm upgrade against the latest chart version, the same muscle memory as upgrading any other Helm-managed component.
Multi-cluster observability: Golden metrics, dynamic Topology, and proactive diagnostics
The dashboard is structured around the questions you ask in production: Is everything healthy? What's slow? What's calling what? What's about to break?
Responding to an incident? You need real-time control plane health and mesh coverage status
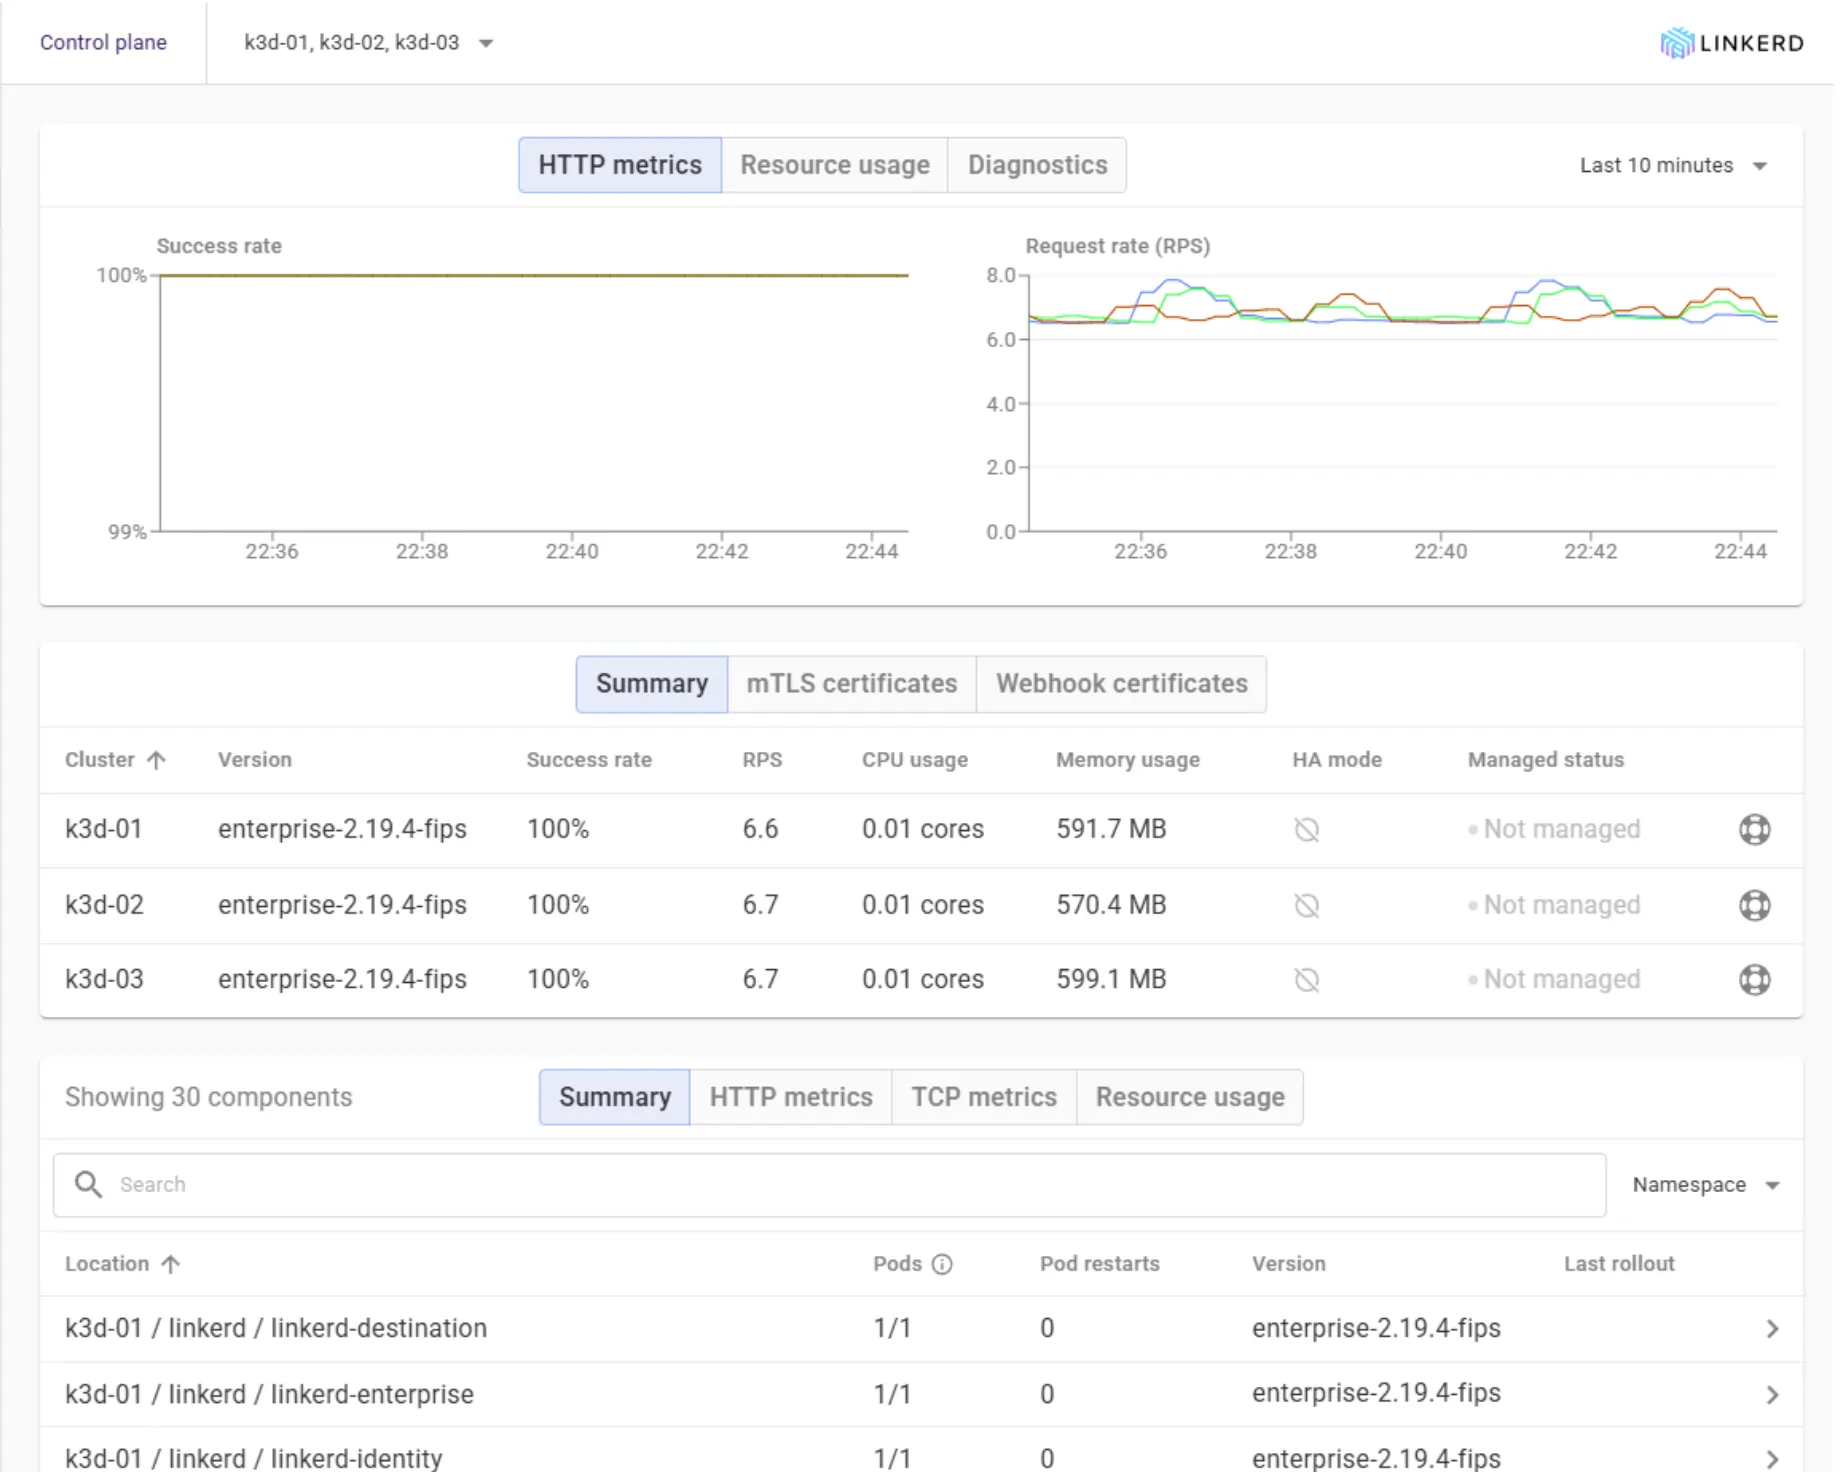
The Overview page is your default during incidents. Control plane and data plane health at a glance, version information, resource usage, the count of meshed versus unmeshed workloads, and a feed of recent events — all on one screen. If you can only look at one place when something starts feeling off, this is it.
The meshed-versus-unmeshed count deserves special attention. It's the easiest way to spot a workload that should be in the mesh but quietly isn't, usually because someone deployed without the injection annotation.
Built-in Golden metrics for every workload
Every meshed workload gets the standard golden metrics for free: HTTP, gRPC and TCP success rates; latency at p50/p95/p99; and request rate. No dashboards to build, no Prometheus queries to write, no Grafana panels to maintain. Real-time CPU and memory usage are also tracked for any Kubernetes workload, meshed or not, so you can correlate traffic anomalies against resource pressure on the same screen.
Historical graphs let you spot trends instead of just the current moment, and the navigation lets you drill from cluster down to namespace down to individual workload without losing context. When something's slow, you can usually answer the "Since when?" question in two clicks.
Real-time dependency graph from observed traffic
Buoyant Cloud builds your dependency graph from observed traffic, not from a manifest you wrote, not from someone's whiteboard, not from a Confluence page that's two reorgs out of date. Every edge on the topology view exists because a request actually traversed it.
The view detects new clients and new dependencies as they appear. The first time a new service starts calling your API, it shows up on the graph. That's the answer to "What's calling this thing now that wasn't last week?" a question that, in most environments, is answered with a Slack message and a shrug.
An example: A data team spins up a pipeline that quietly starts pulling from your customer-profile API for some enrichment work. Nobody mentioned it. A week later your p99 has crept up, and you're hunting for a cause. In the Slack-and-shrug version of this story, that's an afternoon of detective work. In Buoyant Cloud, the new edge appeared on the topology graph the day the first request landed, with the new caller's request rate sitting next to your latency chart.
You can filter by cluster, namespace, or workload and pin nodes to focus on a specific service chain. A common workflow: pin your API gateway, then watch where traffic actually flows downstream. Compare that to the architecture diagram on your wall.
.webp)
You can filter by cluster, namespace, or workload and pin nodes to focus on a specific service chain. A common workflow: pin your API gateway, then watch where traffic actually flows downstream. Compare that to the architecture diagram on your wall.
Correlating observed traffic with authorization policy status
The Traffic view is the same underlying data as Topology, organised as a list with success rates, time-window selection, and, critically, a column for the authorisation policy status of each connection. Whether a request succeeded and whether it was allowed are two questions that belong on the same screen.
Configuration drift, version incompatibility, and event feeds
Buoyant Cloud runs continuous diagnostics against every connected cluster. The Events feed surfaces:
- Version incompatibilities, particularly between the control plane and proxies running older versions after a partial upgrade.
- Certificate expiration warnings, well in advance, not at 3 am the day they expire.
- Configuration drift, where the live state has wandered from what was applied.
- Rollout events, deployments, restarts, things changing.
- New workloads getting meshed or unmeshed, so you notice when something quietly leaves the mesh.
.webp)
In practice, this is what makes the platform feel different from a metrics dashboard. A botched control-plane upgrade tends to surface as a version incompatibility event days before older proxies fail their next handshake. A bad config push lands in the feed before traffic actually starts failing. The lead time isn't always large, but it's almost always more than zero, and zero lead time is what gets someone paged.
This is the surface that earns the "proactive" label. Most of these are problems that will eventually escalate. The point is to catch them before they do.
Real-time diagnostics: Alerting on SLOs, traffic anomalies, and Linkerd health
Once you trust the diagnostics, you wire them into the channels your team already lives in. Buoyant Cloud sends alerts to Slack, PagerDuty, Microsoft Teams, and Datadog out of the box. You can alert on Linkerd health issues, traffic anomalies, rollout events, and SLO breaches.
A piece of practical advice from anyone who's done this: Start broad, refine over time. It's tempting to spend a week designing the perfect alert taxonomy before turning anything on. Don't. Wire up a single Slack channel for everything on day one, watch what fires, then split out PagerDuty for the things that should actually wake someone up. Routing alerts at 2 am to a channel that nobody configured is a worse problem than not having alerts at all.
The integration takes ten minutes. Do it before you need it.
Multi-cluster: One screen for the whole estate
The single biggest payoff of Buoyant Cloud, if you're running more than a couple of clusters, is the cross-cluster view. Compare health and metrics across dev, staging, and production side by side. Spot version drift between environments without a meeting. See your multicluster service-mirroring topology in one place.
"Are all my production clusters running the same Linkerd version?" should not be a question that requires a meeting. With every agent reporting into the same dashboard, it's a glance.
Multi-cluster checklist and agent setup best practices
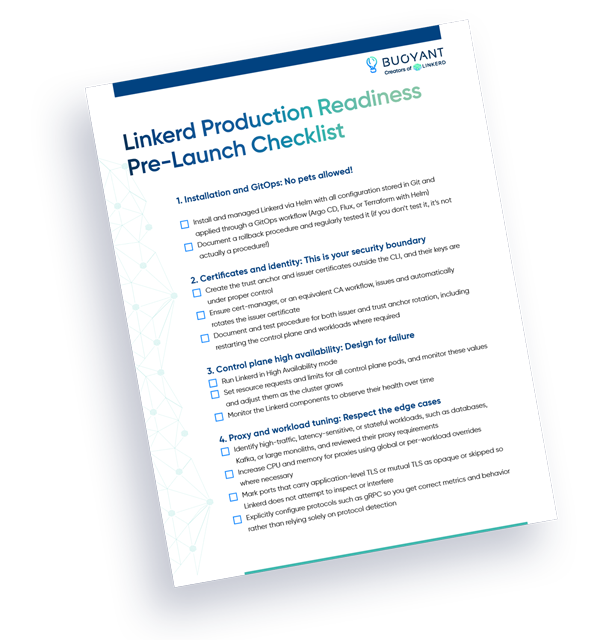
Linkerd's own production readiness is, as we've written before, a practice rather than a switch. The same is true of operational visibility: the tool only matters if you set it up with some care. A short checklist for the first few weeks:
- Pick a cluster naming convention before you install the first agent. Something like
env-region-purpose(prod-eu-west-1-payments) is a fine default. The name persists everywhere in Buoyant Cloud, and renaming after the fact is more friction than it sounds. - Deploy the agent to every cluster, including dev and staging. You won't catch a dev-versus-prod config drift if you only watch prod. Full-estate visibility costs almost nothing; the agent is small.
- Wire alerts on day one. Even if it's just a single Slack channel. Day-one integration is cheaper than retrofitting alerting onto a system that's already in production.
- Exclude the noisy workloads. Use workload exclusion to keep the dashboard signal-to-noise honest. Cron jobs that flap, batch workloads that crash on purpose, dev experiments—quiet them down so the real signals stand out.
- Keep the agent current. A
helm upgradeagainst the latest chart version. Schedule it on the same cadence as your BEL upgrades so it doesn't drift. - Verify image signatures on the agent. Supply-chain hygiene applies to your observability tools too. The 2.19 release pipeline added end-to-end signing for a reason; use it!
- Use "Send Diagnostics" before opening a support ticket. It's a button in the dashboard that bundles the right data for Buoyant support to look at. It saves a round trip.
Common stumbles: Common agent connectivity and data stale issues
A few things that catch teams out:
- Agent can't connect. Almost always an egress rule or a network policy blocking outbound HTTPS. Check the agent pod logs first.
- Cluster name mismatch. If you renamed the cluster after registration, you'll see two entries or stale data. Avoid renames if you can
- Stale data. The agent pod is probably crashlooping.
kubectl get pods -n linkerd-buoyantand check. - Missing metrics for a workload. Workloads without a Linkerd sidecar don't generate proxy metrics. Confirm injection.
- Certificate issues. Check the
buoyant-cloud-org-credentialssecret in thelinkerd-buoyantnamespace.
Production visibility: Translating Linkerd's golden metrics into actionable insights
Production readiness is a practice. So is visibility. Installing Buoyant Cloud doesn't make your mesh healthier by itself. What it does is take the signals your mesh has been producing all along and turn them into something you can act on before something escalates.
The fastest way to feel the difference is to deploy the agent into a single dev cluster, walk through the dashboard for ten minutes, and notice how many of the things you've been tracking by hand are already on a screen waiting for you. Your mesh has been telling you things. This is what it sounds like when you actually listen.
FAQ
Why should I use Buoyant Cloud in a Linkerd multi-cluster deployment?
Buoyant Cloud is a SaaS aggregation layer that collects mesh telemetry from multiple clusters running Buoyant Enterprise for Linkerd (BEL) and stitches it into a single, comprehensive operational view.
What specific data does the Buoyant Cloud agent never collect to ensure application privacy?
The agent never collects application traffic contents (request/response bodies, headers), private keys, or application payloads of any kind, ensuring secure data-handling.
How does Buoyant Cloud proactively help identify problems before they escalate into incidents?
It runs continuous diagnostics, surfacing critical events like version incompatibilities, certificate expiration warnings, and configuration drift in the Events feed, providing lead time to act.
How does the Buoyant Cloud agent securely transmit mesh data without requiring an inbound connection to the cluster?
The agent is push-only, opening a secure outbound HTTPS connection to Buoyant Cloud's endpoints on port 443; the platform never connects back into your cluster.


