

OTel and Mesh-Derived Metrics: A 2026 Reference


Mesut Oezdil
June 10, 2026
If you already run an OpenTelemetry pipeline, you have good visibility into what your applications are doing. This blog post is about what you don’t see yet: the east-west traffic between your services, measured at the network layer with zero changes to your application code.
Linkerd’s proxy provides those metrics. Once a workload is meshed, the proxy immediately emits golden metrics for every inbound and outbound request. No need for instrumentation, SDK calls, or image rebuild. This blog post shows what those metrics look like, where they overlap with OTel, where they don’t, and how to wire them into an existing OTel Collector pipeline so both layers land in the same backend. If you come from the mesh side and are wondering what OTel adds, you'll learn that too.
The setup
The reference environment is K3s v1.34.6 (single node); Linkerd 2.19+ (tested on edge-26.5.5, June 2026); the OpenTelemetry Demo (Astronomy Shop) as the meshed workload; OTel Collector contrib 0.118.0 as a DaemonSet; and VictoriaMetrics with Grafana. The working Collector config and Grafana dashboard are available as downloads at the end of this post.
What OTel covers
The OpenTelemetry specification defines three signal types: traces, metrics, and logs. Traces follow a request across service boundaries and give you the full call graph. Metrics capture numeric measurements over time: counters, gauges, and histograms. Logs are the structured events your application emits.
What auto-instrumentation gives you depends on the language and framework: HTTP request counts, database call durations, and message queue depths. What you write yourself are the business-layer signals: number of orders placed, items added to cart, and payment failures. The OpenTelemetry Demo is a good example: it emits app_cart_add_item_latency_seconds, app_payment_transactions_total, app_recommendations_counter_total, and a handful of other service-specific metrics that no infrastructure layer could infer.
All of this lives at the application layer. OTel instruments your code, but it can’t see traffic that flows between services at the network level unless you explicitly instrument both ends.
What mesh-derived metrics cover
When Linkerd injects a sidecar proxy into a pod, that proxy intercepts all inbound and outbound traffic for the workload. It exposes a Prometheus metrics endpoint at port 4191 on every meshed pod. You don’t need to change a line of application code. You annotate the namespace and roll the deployments. The scope is east-west L7 traffic between meshed workloads; north-south ingress traffic is a separate concern.
A version note before the commands: as of this writing, the Linkerd open source project no longer publishes stable release artifacts; edge releases are the production-ready line (see linkerd.io/releases), and Buoyant Enterprise for Linkerd (BEL) is the supported enterprise distribution. This lab runs edge-26.5.5.
Before injection, the proxy port doesn’t exist. On an unmeshed pod in the otel-demo namespace:
kubectl exec -n otel-demo ad-74784f8f59-4nmwp -- wget -qO- http://localhost:4191/metrics 2>&1Nothing is listening on 4191. After annotating the namespace with linkerd.io/inject=enabled and rolling the deployments, every pod goes from 1/1 to 2/2 Ready. The second container is linkerd-proxy. Run the same command against the new pod, adding -c ad to land in the app container (the proxy image ships no wget), and the proxy answers with its full metrics exposition. Here’s 1 counter from that output, with its help text (labels trimmed for readability):
# HELP request_total Total count of HTTP requests.
request_total{direction="inbound", target_addr="10.42.0.217:8080", tls="true", client_id="otel-demo.otel-demo.serviceaccount.identity.linkerd.cluster.local", ...} 20
The client_id label is the mTLS identity of the caller. That’s something no application-level metric gives you: cryptographic proof of who is talking to whom on every request counter.
The metric families this blog post builds on, are all available with Linkerd 2.19+:
response_total: total response count, labeled withdirection,classification(success or failure),status_code, grpc_status, and the destination workloadresponse_latency_ms: response latency histogram. Per the metric’s own help text, it measures the elapsed time between a request’s headers being received and its response stream completingtcp_open_connections, tcp_read_bytes_total, tcp_write_bytes_total: TCP-level gauges and counters
The first 2 are where Linkerd’s golden metrics come from: success rate, request rate, and latency are all computed from them. The TCP counters add connection-level visibility alongside.
One scope note up front: the proxy also exposes per-route families (outbound_http_route_*, with _seconds histograms, not _ms). This post’s pipeline deliberately does not ship them: the filter keeps the 5 families above, and per-route metrics bring different units and another layer of cardinality. I treat them as future work rather than a headline; the families above work end-to-end and are the ones worth building on first.
The full proxy metrics reference is at linkerd.io/docs/reference/proxy-metrics/.
The overlap
Request rate, latency, and errors appear in both layers. They’re the same signals, measured differently.
Take the request rate. The mesh side has response_total{layer="mesh"}, counted by the proxy for every response it returns. You saw a raw request_total counter in the proxy output earlier; this post’s pipeline deliberately keeps response_total instead, so request rate is measured from completed responses, which also carry the classification and grpc_status labels. The app side has app_frontend_requests_total, counted by the frontend’s own OTel instrumentation. Same signal, but different metric names and label sets: the mesh series carries client_id, classification, and grpc_status; the app series carries whatever dimensions the developers chose to record.
Latency tells the same story. On the mesh side, response_latency_ms_bucket{layer="mesh"} measures the elapsed time between a request’s headers being received and its response stream completing. On the app side, app_cart_add_item_latency_seconds_bucket measures the time the cart service’s own instrumentation recorded for the same operation.
Here are both on one chart:

The mesh and app measurements won’t be identical. The proxy measures network-level timing; the application measures its own internal processing. The gap between them can surface network overhead, queuing, or slow middleware.
Which one to trust for what:
- For mTLS identity and east-west success rate, trust mesh metrics. The proxy is the authoritative source because it observes the actual connection, not what the app reports about itself.
- For business semantics and custom dimensions, trust OTel app metrics. Only your code knows that a request was a “checkout” for a “platinum” customer.
- For root causes, trust distributed traces. The mesh sees failure rates; traces show you the call graph and tell you which span failed.
The non-overlap
Now let’s look at where they complement each other.
OTel covers what the application knows: custom business metrics, per-request traces, app-layer events, and infrastructure metrics you wire up explicitly. Mesh metrics cover L7 east-west service-to-service traffic, as observed by the proxy.
The cleanest way to see the difference is with a failure. In the OpenTelemetry Demo, the frontend service makes regular calls to the ad service. The mesh sees these (labels trimmed for readability):
response_total{direction="outbound", status_code="200", dst_service="ad",
classification="failure", grpc_status="14", ...} 6Look at the label pair: status_code="200" and grpc_status="14". The HTTP layer reports success; the gRPC status is UNAVAILABLE. In gRPC, the status code travels in the response trailers, separately from the HTTP status line, so if you only alert on HTTP status codes, this failure is invisible. The proxy reads that status and classifies the response as a failure anyway. The mesh knows the call failed and how many times, but it doesn’t know why.
A Jaeger trace for the same operation tells the rest of the story:

The trace shows the exact span that failed, the exact error message, and the client and server addresses involved. The mesh flags the issue while the trace shows you the root cause.
The same separation applies to business metrics. app_payment_transactions_total and app_recommendations_counter_total show up on the app side because the OTel Demo’s own instrumentation emits them. No proxy can infer that a request was a payment or a recommendation. That domain knowledge lives in the code.
The integration pattern
The goal is to get mesh metrics into the same backend as your OTel metrics, tagged so you can tell them apart. The mechanism is a dedicated pipeline in your OTel Collector.
Here’s the relevant portion of the Collector config (the full file is downloadable alongside this post):
receivers:
  prometheus/mesh:
    config:
      scrape_configs:
        - job_name: linkerd-mesh
          scrape_interval: 30s
          kubernetes_sd_configs:
            - role: pod
          relabel_configs:
            - source_labels: [__meta_kubernetes_pod_container_name]
              action: keep
              regex: linkerd-proxy
            - source_labels: [__meta_kubernetes_pod_ip]
              action: replace
              target_label: __address__
              regex: (.+)
              replacement: $1:4191

processors:
  filter/mesh:
    error_mode: ignore
    metrics:
      metric:
        - 'not(name == "response_total" or IsMatch(name, "response_latency_ms.*") or name == "tcp_open_connections" or name == "tcp_read_bytes_total" or name == "tcp_write_bytes_total")'

  resource/mesh:
    attributes:
      - key: layer
        value: mesh
        action: insert

service:
  pipelines:
    metrics/mesh:
      receivers: [prometheus/mesh]
      processors: [memory_limiter, filter/mesh, resource/mesh, resourcedetection, k8sattributes, batch]
      exporters: [prometheusremotewrite]
The prometheus/mesh receiver uses Kubernetes pod discovery to find every container named linkerd-proxy and scrapes port 4191. The filter/mesh processor, written in the OpenTelemetry Transformation Language (OTTL), keeps only the 5 metric families listed earlier. The resource/mesh processor inserts layer=mesh on every series, and k8sattributes enriches each one with pod, namespace, deployment, and node metadata. The pipeline is separate from your existing metrics pipeline, so there’s no interference.
One gotcha from this setup cost me real debugging time: the replacement: $1:4191 relabel rule trips over the Collector’s $-based environment variable expansion on some versions, and the config is rejected at startup. I hit it on contrib 0.104.0 in an earlier run, where the confmap.unifyEnvVarExpansion feature gate was the cause (workaround then: --feature-gates=-confmap.unifyEnvVarExpansion). The same failure is reported upstream on 0.112.0, rejecting even an escaped $$1:$$2 replacement. Contrib 0.118.0, the version this lab pins, accepts the config. Pin your image tag.
Here’s how the pipeline fits together. Mesh metrics flow through the Collector into VictoriaMetrics; the OTel Demo’s app metrics stay in its bundled Prometheus. Grafana reads both as separate data sources, which is exactly how the downloadable dashboard’s mixed panel is wired:
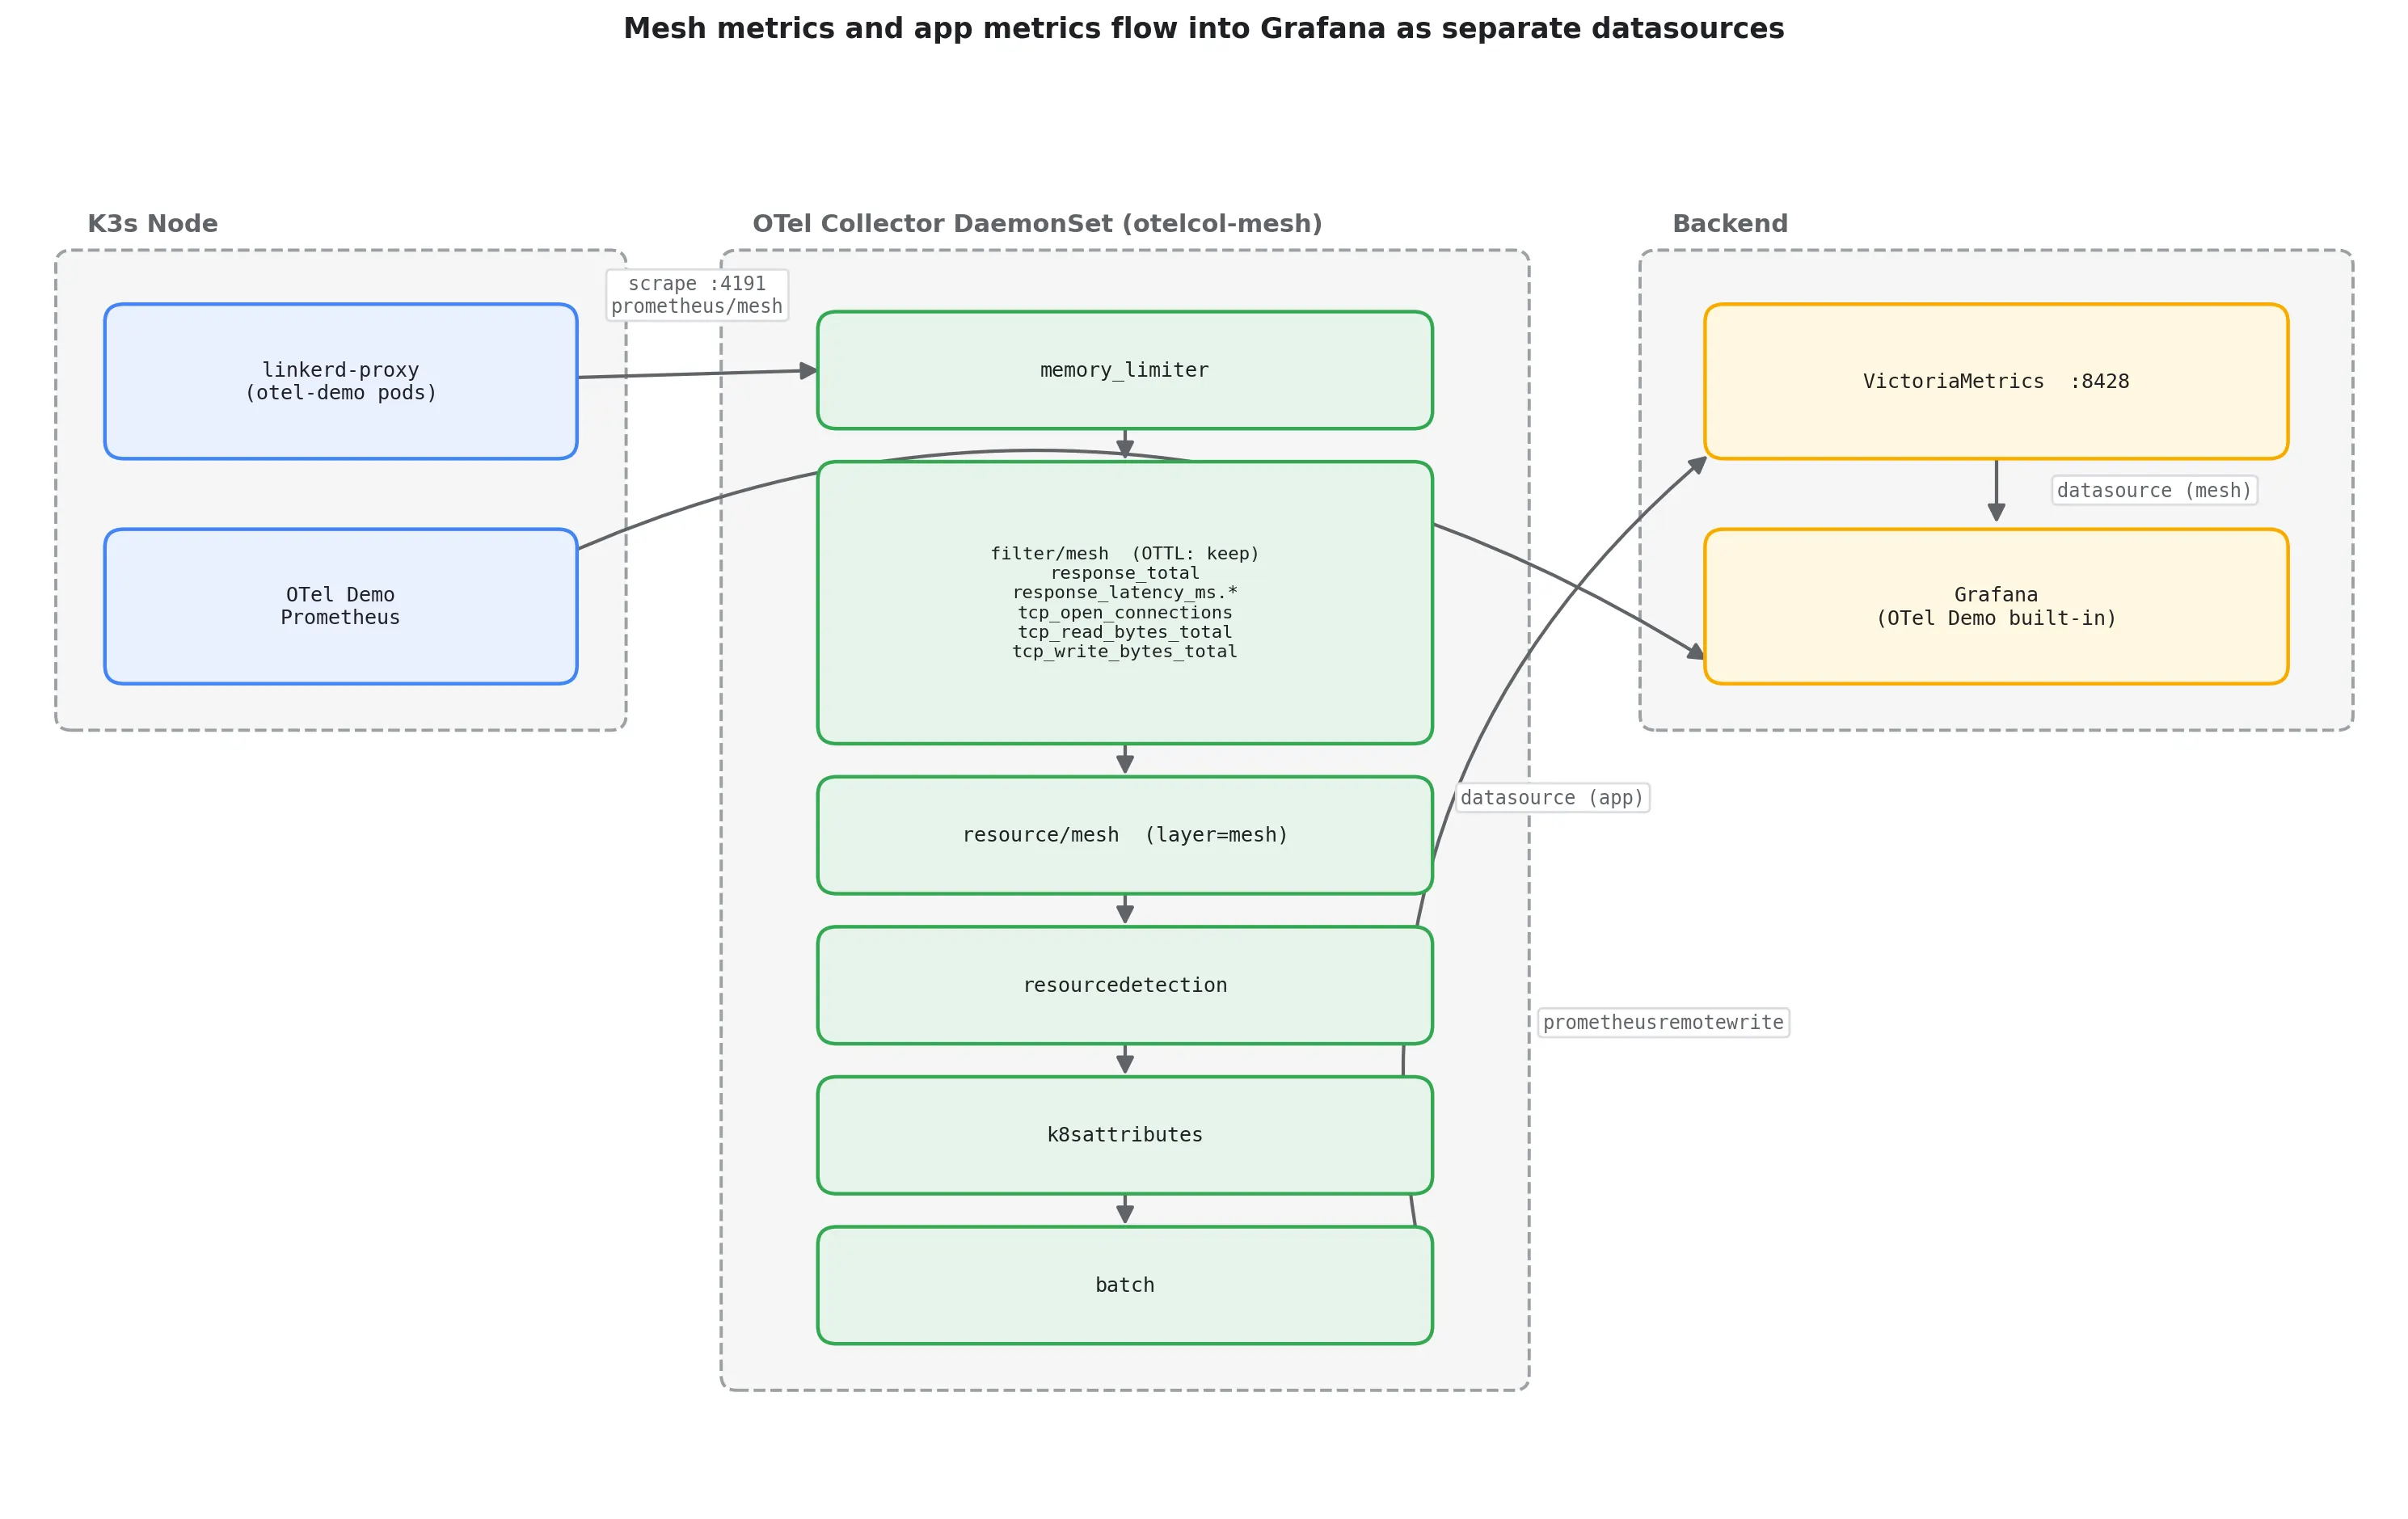
The Grafana dashboard JSON is downloadable alongside this post. It uses a mixed datasource panel: query A pulls response_latency_ms_bucket{layer="mesh"} from VictoriaMetrics; query B pulls app_cart_add_item_latency_seconds_bucket from your Prometheus datasource. Both lines populate when the workload is meshed and OTel-instrumented. When import-testing, both datasource inputs are prometheus-type and easy to point at the same source by accident. Map the mesh input to VictoriaMetrics and the app input to your Prometheus.
This reference stack uses VictoriaMetrics and the OTel Demo’s built-in Grafana. The pattern works with any Prometheus-compatible backend. The stack also includes VictoriaLogs for application logs; that pipeline is out of scope for this post.
The Collector config is also maintained in the myOTel reference stack, which this lab’s setup was adapted from. The namespace and storage class differ, but the pipeline is the same.
A short note on cardinality
Proxy metrics come with a lot of labels. A single response_latency_ms_bucket series, as stored in VictoriaMetrics after this pipeline’s enrichment, carries 35 labels: direction, tls, client_id, authz_kind, route_name, srv_name, le, and more. Some are proxy-emitted, others are added by k8sattributes and the resource processors. Every combination of those label values is its own series, once per histogram bucket, on every meshed pod. This lab’s scrape covers 30 meshed pods: the 25 OTel Demo pods, the pipeline’s own Collector and VictoriaMetrics, and Linkerd’s 3 control-plane pods, since the scrape keeps every linkerd-proxy container in the cluster. response_latency_ms_bucket alone produced 5,642 series, and the whole job="linkerd-mesh" scrape totaled 9,280 series after filtering. Both numbers are post-filter, and that’s the point: filtering by metric family shortens the name list, but it does nothing to the label cardinality inside a family you keep. A histogram you keep is a histogram you pay for.
Without filtering, the proxy exposes 163 distinct metric families. After the filter/mesh processor keeps only those 5 families, 11 metric names arrive in VictoriaMetrics: the 5 families export as 7 names (each histogram splits into _bucket, _count, and _sum), 3 more leak from control_response_latency_ms_*, and the last is the exporter-generated target_info. Where those extras come from is the next topic.
You have 2 places to do this filtering, and I tested both on contrib 0.118.0 in this lab. The first is a metric_relabel_configs keep rule in the prometheus receiver:
metric_relabel_configs:
	- source_labels: [__name__]
      action: keep
      regex: "response_total|response_latency_ms.*|tcp_.*"
With this rule active and no OTTL filter, 15 metric names flowed into VictoriaMetrics: 9 proxy names matching the regex, plus 6 names the keep rule never sees. Those 6 are the scrape’s own synthetic series (up, scrape_duration_seconds, scrape_samples_scraped, scrape_samples_post_metric_relabeling, scrape_series_added), which metric relabeling doesn’t apply to, and target_info, which the prometheusremotewrite exporter generates after the processors run.
The second is the OTTL filter/mesh processor from the integration section, which lands at 11 names: 163 families in, 11 out. The gap between 11 and 15 matters when you pick. The relabel regex is fully anchored, so response_latency_ms.* doesn’t admit control_response_latency_ms_*; OTTL's IsMatch is unanchored, so those 3 control-plane names leak through it. In the other direction, tcp_.* in the keep rule admits every TCP family the proxy exposes, tcp_open_total and tcp_close_total included, while the OTTL list names its 3 TCP metrics explicitly. And only the OTTL filter drops the synthetic scrape series.
This reference config ships the OTTL filter: the keep list lives in the pipeline next to the processors that tag and enrich the data, and the synthetic series stay out of the backend. The relabel route is also a good choice, and it filters at scrape time, before samples enter the pipeline; just write the regex with anchoring in mind and expect up and the scrape_* series to flow.
Where each one earns its place
OTel gives you what your application knows about itself: business events, custom dimensions, and distributed traces that follow a request across every service boundary. Linkerd gives you what the network knows: every east-west request between your meshed services, with mTLS identity, success rate, and latency, with zero changes to your code.
The two are complementary. An OTel pipeline without mesh metrics is missing the service topology layer. A mesh without OTel instrumentation can tell you a request failed but not why.
If you’re already running OTel, adding the mesh pipeline is one Collector config change and a namespace annotation. The Grafana dashboard in this blog post shows both layers on one chart the moment you do.
About the Author: Mesut is a DevOps Engineer at Adfinis GmbH and a cloud native open source contributor (Project HAMi, kagent), based in Stuttgart, Germany. You can find his work on GitHub: https://github.com/mesutoezdil and connect with him on LinkedIn: https://www.linkedin.com/in/mesut-oezdil//
Frequently asked questions
What metrics does Linkerd’s proxy expose out of the box?
Linkerd’s proxy emits response_total, response_latency_ms, tcp_open_connections, tcp_read_bytes_total, and tcp_write_bytes_total on port 4191 of every meshed pod, covering success rate, request rate, and latency for all east-west L7 traffic.
Do I need to change my application code to get Linkerd mesh metrics?
No code changes required. Annotate the namespace with linkerd.io/inject=enabled and roll the deployments. Every pod goes from 1/1 to 2/2 Ready; the second container is linkerd-proxy, which starts emitting metrics immediately.
How do OTel app metrics and service mesh metrics differ?
OTel instruments your code: business events, custom dimensions, and distributed traces. A service mesh measures at the network layer: every east-west request between meshed services, with mTLS identity and gRPC status, without any SDK calls.
How do you add Linkerd mesh metrics to an existing OTel Collector pipeline?
Add a prometheus/mesh receiver that discovers linkerd-proxy containers via Kubernetes pod discovery and scrapes port 4191. Use a filter/mesh processor to keep the 5 core metric families, tag them with layer=mesh, and export alongside your existing pipeline.


