Linkerd Connection Timeouts: How to Tune TCP Backlog and Proxy Workers

.webp)

September 16, 2026
Working as a Customer Escalation Engineer on Linkerd, I get requests from companies with all kinds of setups, traffic, and workloads. Recently, several customers asked about connection timeouts they couldn't explain, and one wondered why Linkerd's CPU annotation didn't match real CPU usage. At first, these seemed like separate problems, but they actually have the same root cause: how the proxy queues incoming connections and how many workers are available to handle them.
If you run into problems in this area, what you’re likely to see is simply dropped connections. During a sudden traffic burst or a period of increased network latency, proxies may start logging connect timed out after 1s, but the server-side metrics remain unchanged – but every request to a meshed pod is measured and labeled, so how can dropped traffic not show up in the proxy metrics?
Sometimes the network itself is the problem, but in many cases what’s happening is that the connection is delayed in a part of the path where our usual metrics simply can’t see what’s happening. This article looks at two places where that can happen: the TCP listener backlog, where incoming connections wait to be accepted, and the proxy runtime workers, which process them once they are accepted. We’ll look at how both work, which settings control them, and how to determine which one is actually limiting your workload.
The TCP listener backlog: the kernel's queue in front of the Linkerd proxy
Before a connection reaches the Linkerd proxy, it first goes through the kernel. Depending on the phase, the kernel puts connections into two queues:
- the SYN queue, which holds half-open connections that are still waiting for the client’s ACK that’s part of TCP connection startup
- the accept queue, which holds fully established connections waiting for the application to process them. This is known as the TCP listener backlog.
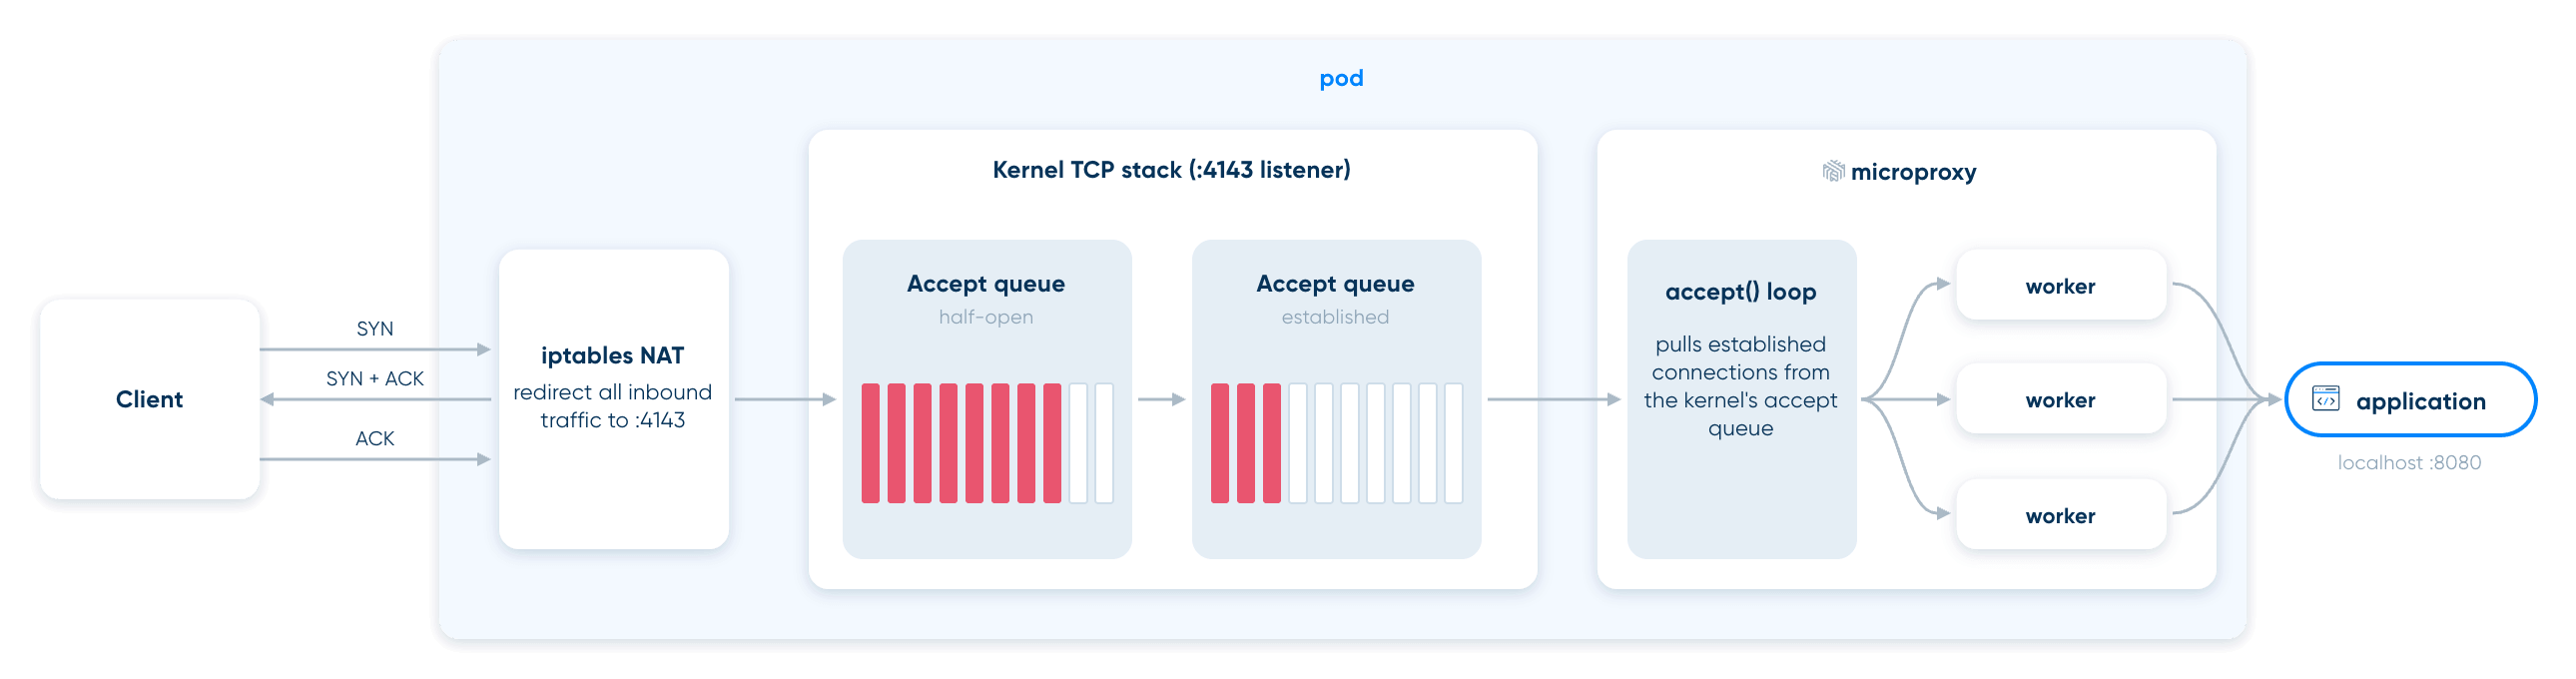
If the accept queue is full, the kernel silently drops packets. This causes a connect timed out after 1s error on the client side.
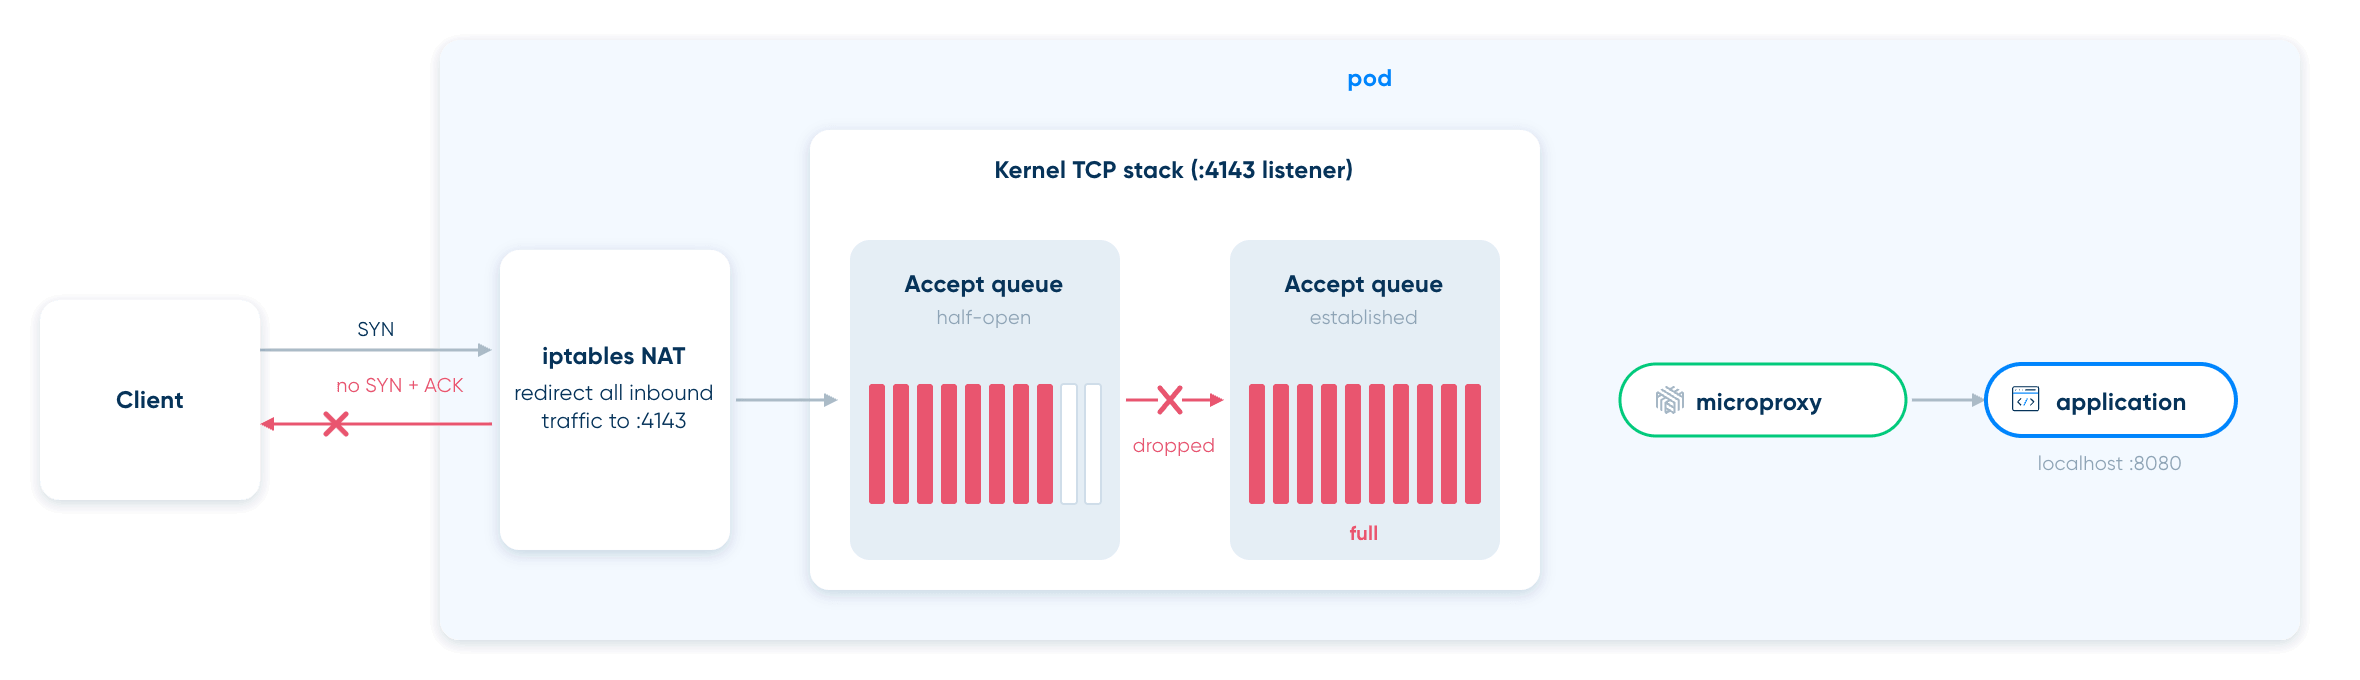
You won't see this in the server's proxy metrics because the proxy never saw the connection. The kernel tracks these events with two counters: TcpExtListenOverflows (when a completed handshake finds the accept queue full) and TcpExtListenDrops (all drops on listening sockets). You can check the queues and counters from inside the pod:
kubectl debug -it -n simple-app simple-app-v1-6bf978ccb4-m2m2q \ --image=nicolaka/netshoot --target=linkerd-proxy -- \ sh -c 'ss -ltn; nstat -az TcpExtListenOverflows TcpExtListenDrops'
State  Recv-Q Send-Q Local Address:Port Peer Address:Port
LISTEN 0      128          0.0.0.0:4143      0.0.0.0:*
LISTEN 0      128          0.0.0.0:4191      0.0.0.0:*
LISTEN 0      128        127.0.0.1:4140      0.0.0.0:*
LISTEN 0      4096               *:5678            *:*
#kernel
TcpExtListenOverflows           0                  0.0
TcpExtListenDrops               0                  0.0
A quick note: the three sockets with a TCP backlog of 128 belong to the proxy. Port 4143 is the inbound listener, 4140 is the outbound one, and 4191 is the admin server. The application itself listens on 5678 and requests 4096 slots. But once the pod is meshed, iptables redirects all inbound traffic to the proxy's port 4143, so the queue in front of your service is now the proxy's 128. Even if your app sets its backlog to 4096, the proxy's setting matters. Both TcpExtListenOverflows and TcpExtListenDrops counters at zero means things are healthy; we'll see them change soon.
The muscles of the Linkerd proxy: the workers
After the kernel hands over a connection, the proxy takes over. The linkerd2-proxy's uses Tokio worker threads to actually do work. These are threads that accept connections from the TCP backlog, handle TLS handshakes, route requests, and more. The runtime can be single-threaded or multi-threaded, and the proxy announces which mode it uses in its first log lines.
kubectl logs -n simple-app    simple-app-v4-dbb8698ff-m9wlw -c linkerd-proxy
[     0.000040s]  INFO ThreadId(01) linkerd2_proxy: release 2.19.5 (ec0c3ea) by Buoyant, Inc. on 2026-03-07T01:32:27Z
[     0.001402s]  INFO ThreadId(01) linkerd2_proxy::rt: Using single-threaded proxy runtime
or
kubectl logs -n simple-app    simple-app-v3-chb7148fd-f9gld -c linkerd-proxy
[     0.000040s]  INFO ThreadId(01) linkerd2_proxy: release 2.19.5 (ac2d6fb) by Buoyant, Inc. on 2026-03-07T01:32:27Z
[     0.001402s]  INFO ThreadId(01) linkerd2_proxy::rt: Using multi-threaded proxy runtime cores=3
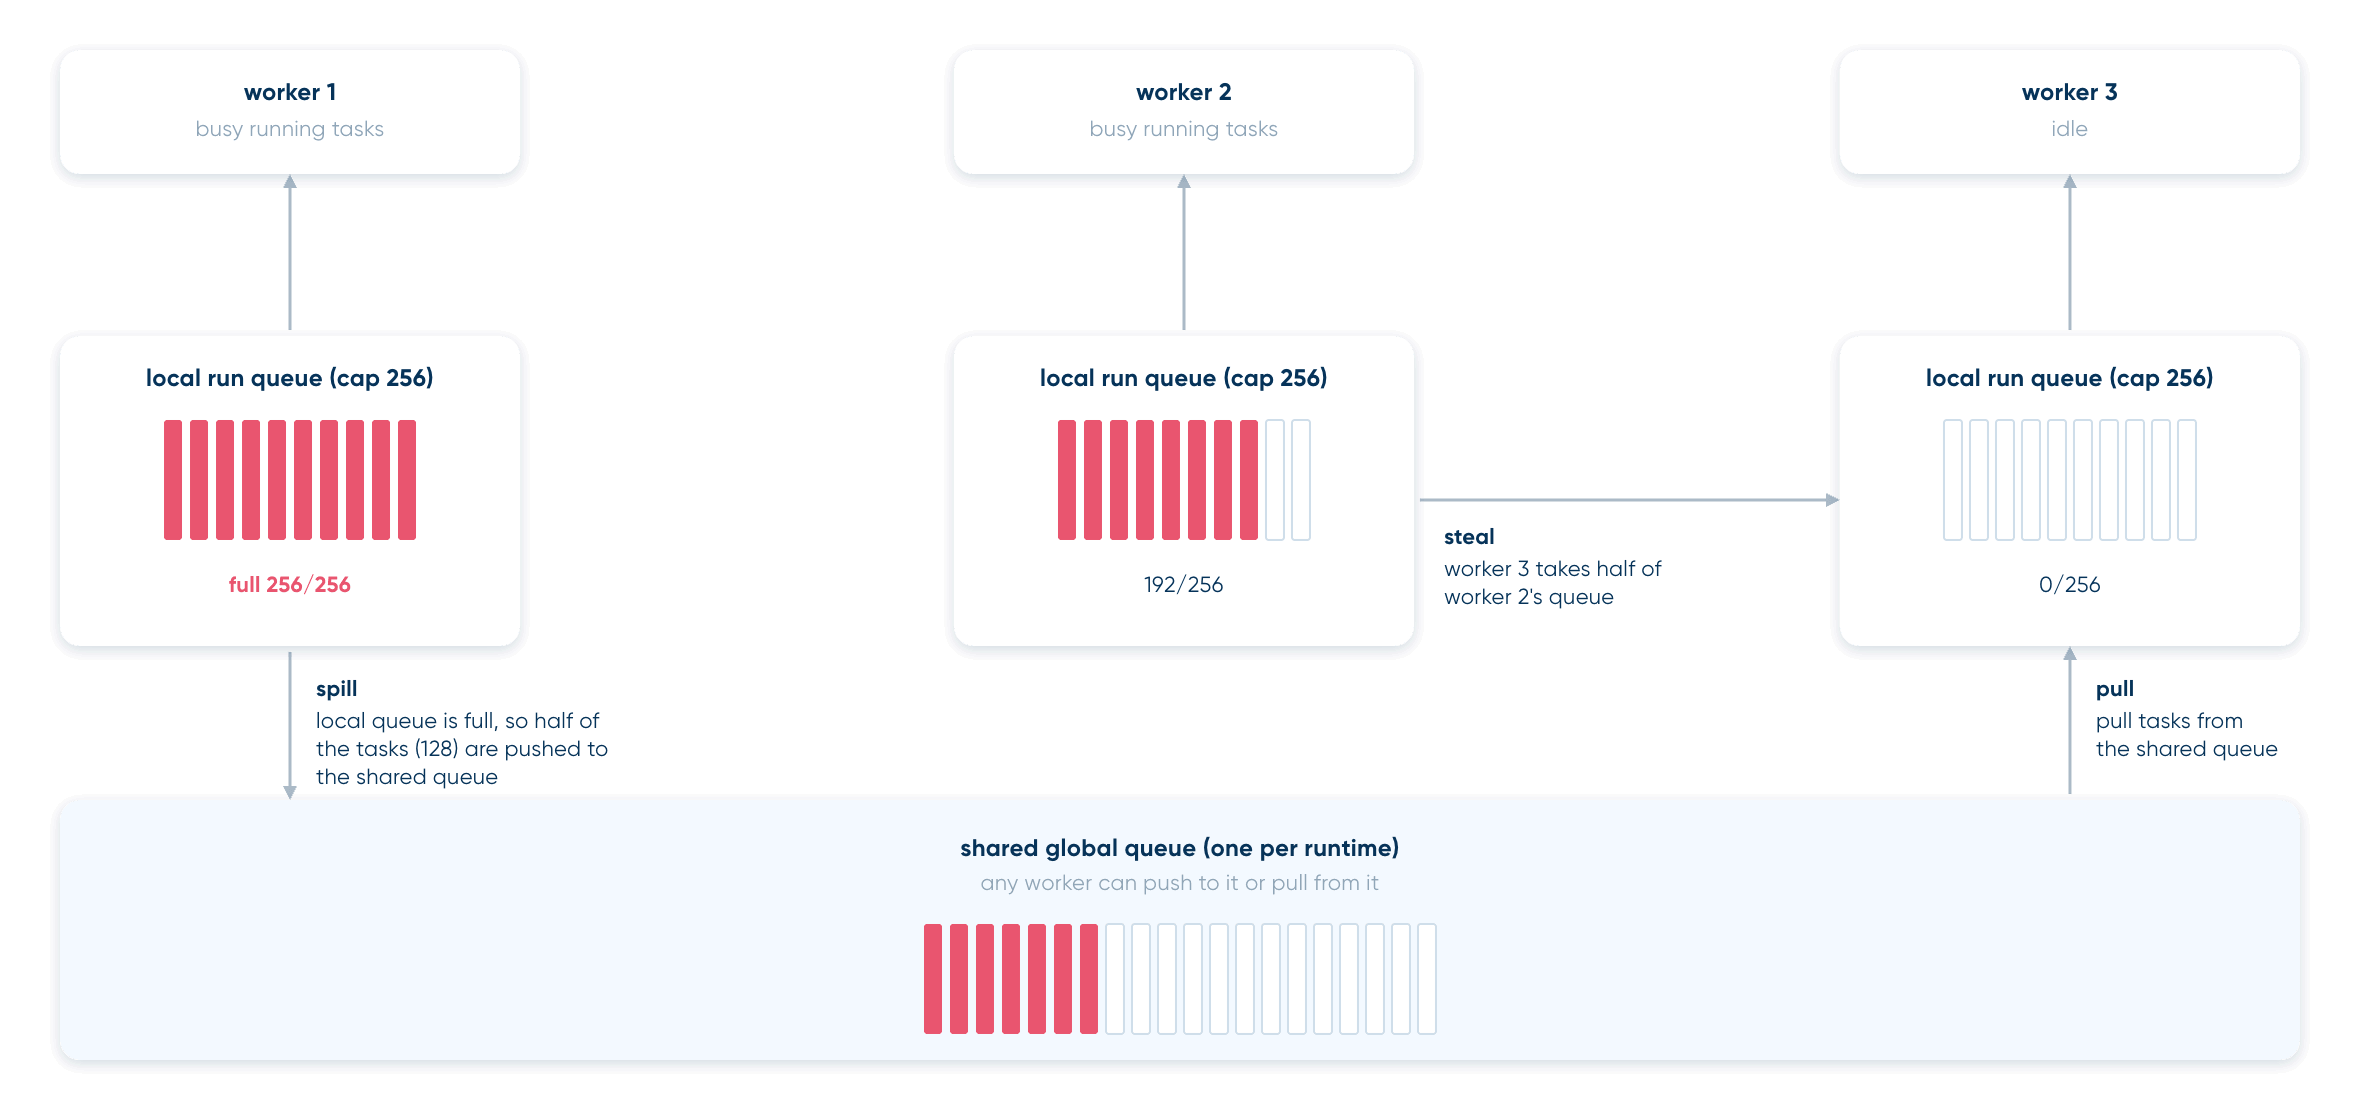
In a multi-threaded runtime, each worker has its own local run queue with a fixed capacity of 256 tasks, and all workers can also use a shared queue. Two mechanisms help keep the workers balanced:
- If a worker's local queue fills up, it spills half of it into the shared queue for others to pick up.
- If a worker runs out of work, it steals tasks from a busier sibling.
Tuning the two layers: backlog size and worker count
Start with the workers, since their configuration has an important detail that's easy to overlook. The proxy sets its worker count at startup based on the CPU configuration it finds. If it doesn't find any, it uses proxy.runtime.workers.minimum, which defaults to 1. So, even on a 64-core node, if no limits are set, the proxy will use only one worker and ignore the other 63 cores. This setup might look generous, but it isn't.
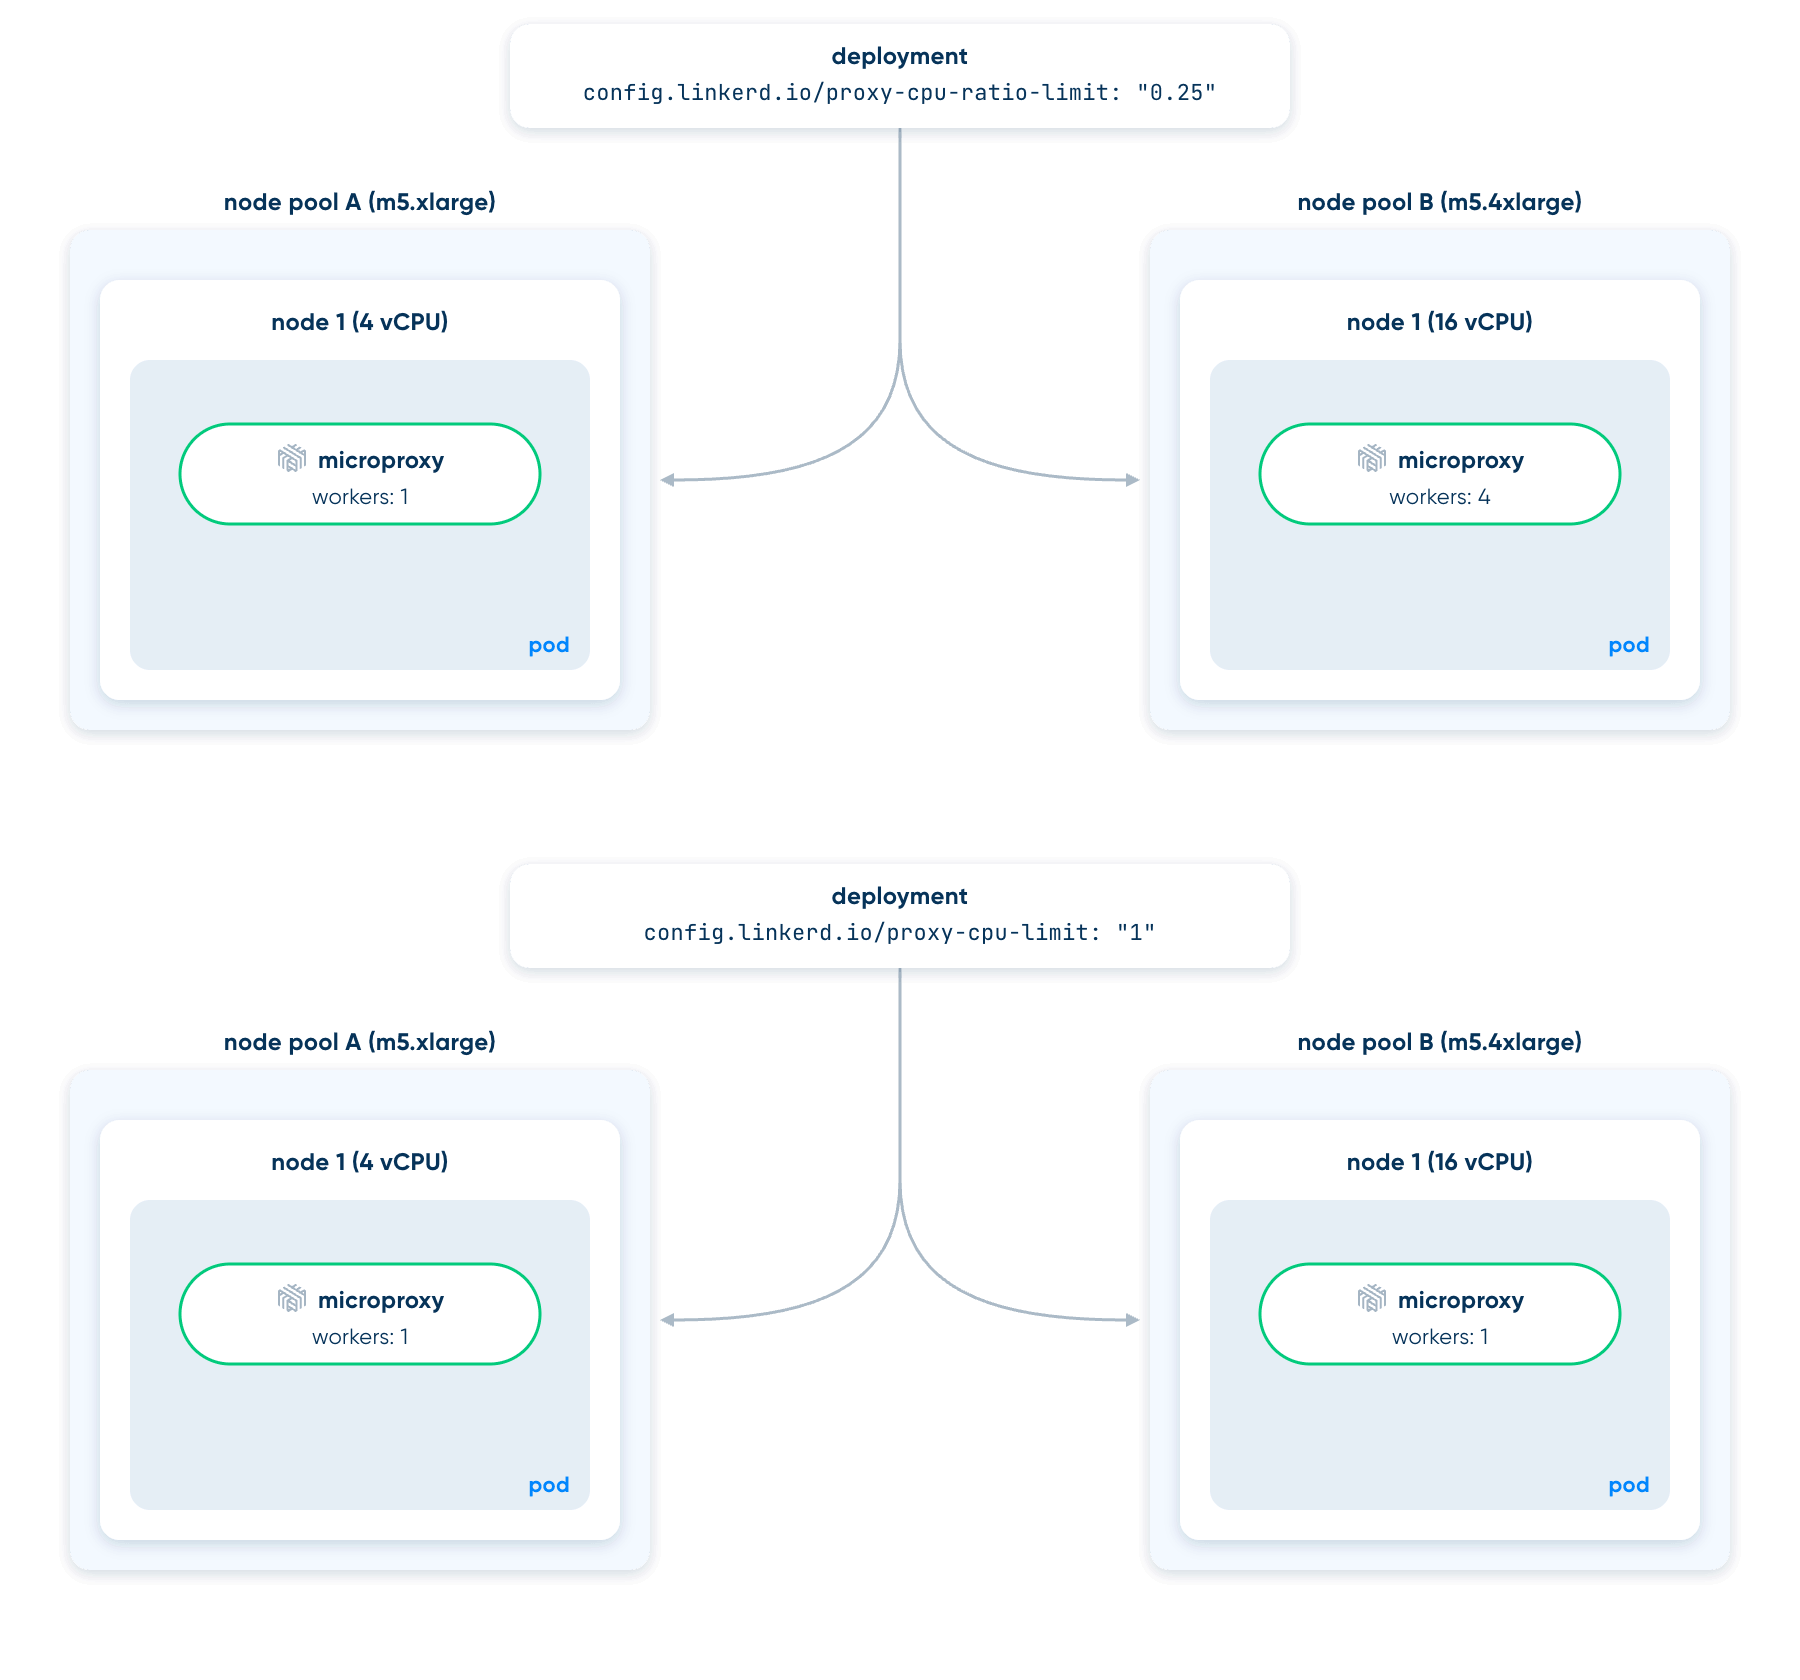
If you set config.linkerd.io/proxy-cpu-limit: "2" you'll get two workers and a resources.limits.cpu will be set on the proxy container.
On clusters with different node sizes, though, application pods may be spread across nodes with wildly different available resources, so trying to assign specific CPU counts can be a non-starter. To help, the Linkerd team created the proxy.runtime.workers.maximumCPURatio Helm Chart value and the config.linkerd.io/proxy-cpu-ratio-limit annotation. These let you size the worker pool as a fraction of the node's cores. Suppose your EKS cluster has two node pools: one uses m5.xlarge instances (4 vCPUs) for general workloads, and the other uses m5.4xlarge instances (16 vCPUs) for heavier services. Since the same Deployment could run on either pool, setting a fixed proxy-cpu-limit of "2" would be too high for the smaller nodes and would not use most of the resources on the larger nodes. To handle this, add a ratio annotation to the workload or its namespace:
metadata:
 annotations:
   config.linkerd.io/proxy-cpu-ratio-limit: "0.25"
With this setup, the proxy sets its worker pool size at startup based on the node it runs on. For example, a pod on an m5.xlarge gets 1 worker (0.25 × 4), while the same pod on an m5.4xlarge gets 4 workers (0.25 × 16).
The backlog is simpler: it's 128 for both inbound and outbound unless you change it. Since BEL 2.20, you can configure the inbound/outbound listener's backlog with an environment variable, which you can set for the whole mesh from the chart:
helm upgrade linkerd-enterprise-control-plane \
  linkerd-buoyant/linkerd-enterprise-control-plane \
  --namespace linkerd \
  --reuse-values \
  --set-json 'proxy.additionalEnv=[
{"name":"LINKERD2_PROXY_INBOUND_TCP_LISTEN_BACKLOG","value":"1024"},
{"name":"LINKERD2_PROXY_OUTBOUND_TCP_LISTEN_BACKLOG","value":"1024"}
  ]'
One important thing to note is that LINKERD2_PROXY_INBOUND_TCP_LISTEN_BACKLOG and LINKERD2_PROXY_OUTBOUND_TCP_LISTEN_BACKLOG each control different listeners, and they work independently. If you only set one, the other will stay at its default value of 128. For example, later we set only LINKERD2_PROXY_INBOUND_TCP_LISTEN_BACKLOG. This increased the backlog for port 4143 (the inbound proxy path) and port 4191 (the inbound admin path), but port 4140, which handles outbound traffic, still used the default of 128.
Overflow, busyness, and more: the metrics the proxy exposes
As mentioned earlier, every request to a meshed pod is measured and labeled. For workers, the proxy exports its runtime state in the tokio_rt metric family, which you can read directly from any meshed pod:
linkerd diagnostics proxy-metrics -n simple-app po/simple-app-v1-6bf978ccb4-m2m2q | grep tokio_rt
linkerd diagnostics proxy-metrics -n simple-app po/simple-app-v1-6bf978ccb4-m2m2q | grep tokio_rt
tokio_rt_workers 1
tokio_rt_park_total 107542
tokio_rt_noop_total 12538
tokio_rt_steal_total 0
tokio_rt_steal_operations_total 0
tokio_rt_remote_schedule_total 4
tokio_rt_local_schedule_total 479172
tokio_rt_overflow_total 0
tokio_rt_polls_total 479175
tokio_rt_busy_seconds_total 15.114254765000024
tokio_rt_injection_queue_depth 0
tokio_rt_local_queue_depth 0
tokio_rt_budget_forced_yield_total 0
tokio_rt_io_driver_ready_total 89746
...Four of them are particularly important to understand what’s happening:
tokio_rt_workersreports the worker count, and should match the cores= value from the startup log line.tokio_rt_busy_seconds_totalaccumulates the time workers spent doing work rather than waiting for it.tokio_rt_overflow_totalcounts the spill mechanism from earlier: each time a worker's 256-slot local queue fills and half of it moves to the shared queue, the counter goes up by one.tokio_rt_steal_totaltracks the opposite move: an idle worker taking tasks from a busy one.
Example
Now let’s see this in action. We’ll test three configurations under the same load:
- A backlog of 128 (default) with one worker
- A backlog of 1024 with one worker
- A backlog of 128 (default) with four workers
We’ll follow the traffic through each layer, then compare the results from the client’s perspective.
The setup
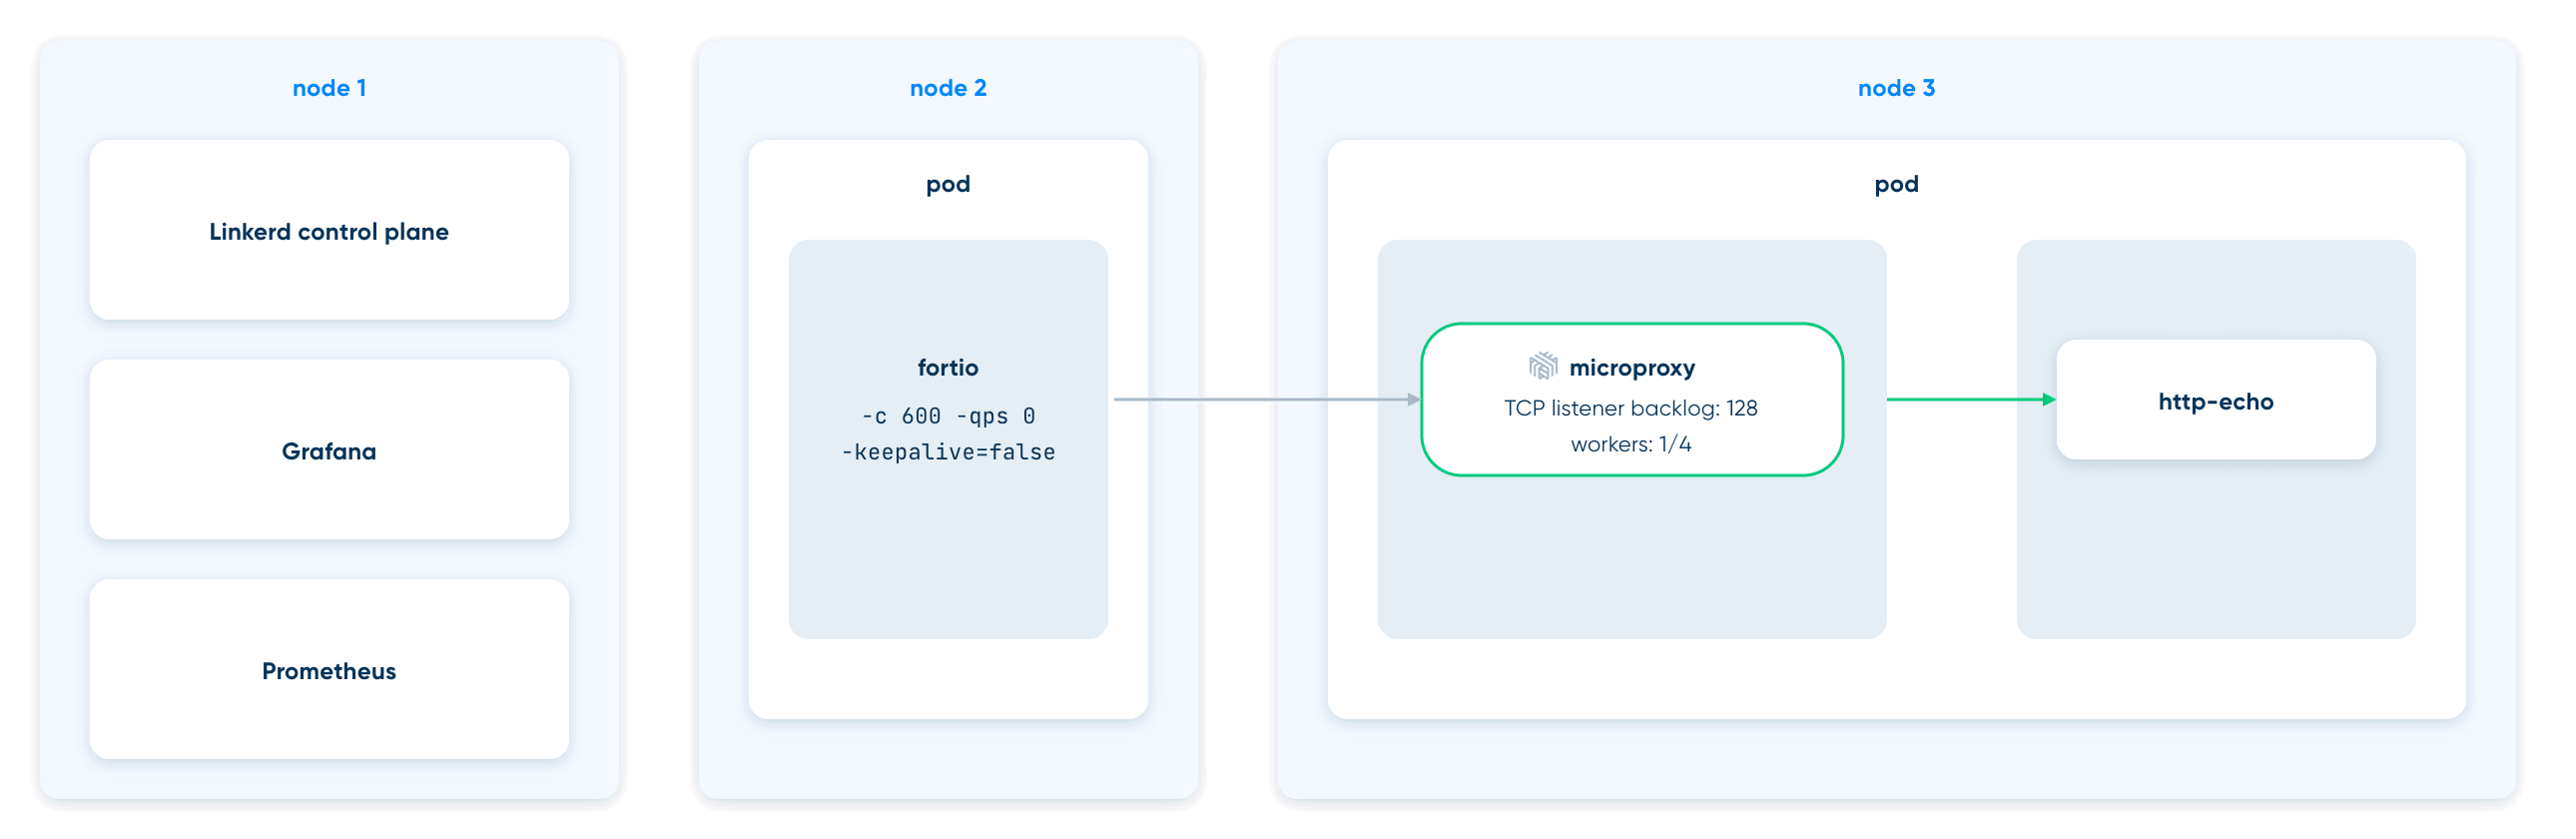
A three-node k3d cluster running BEL 2.20.2 with two workloads:
- server: a meshed
hashicorp/http-echoanswering ok on port 5678, pinned to one node using anodeSelector. - client: an unmeshed Fortio instance, pinned to the other node using a
nodeSelector.
Every case gets the same open-loop load of 20,000 requests per second across 600 threads (which will show different throughput), and each request opens a new TCP connection (so each request is one `accept()` on the proxy's inbound listener), over 60 seconds, via the following:
fortio load -qps 20000 -c 600 -uniform -jitter -nocatchup -sequential-warmup -keepalive=false -allow-initial-errors -timeout 500ms -t 60s http://server/The overall topology is the following:
Layer 1: the kernel’s accept queue
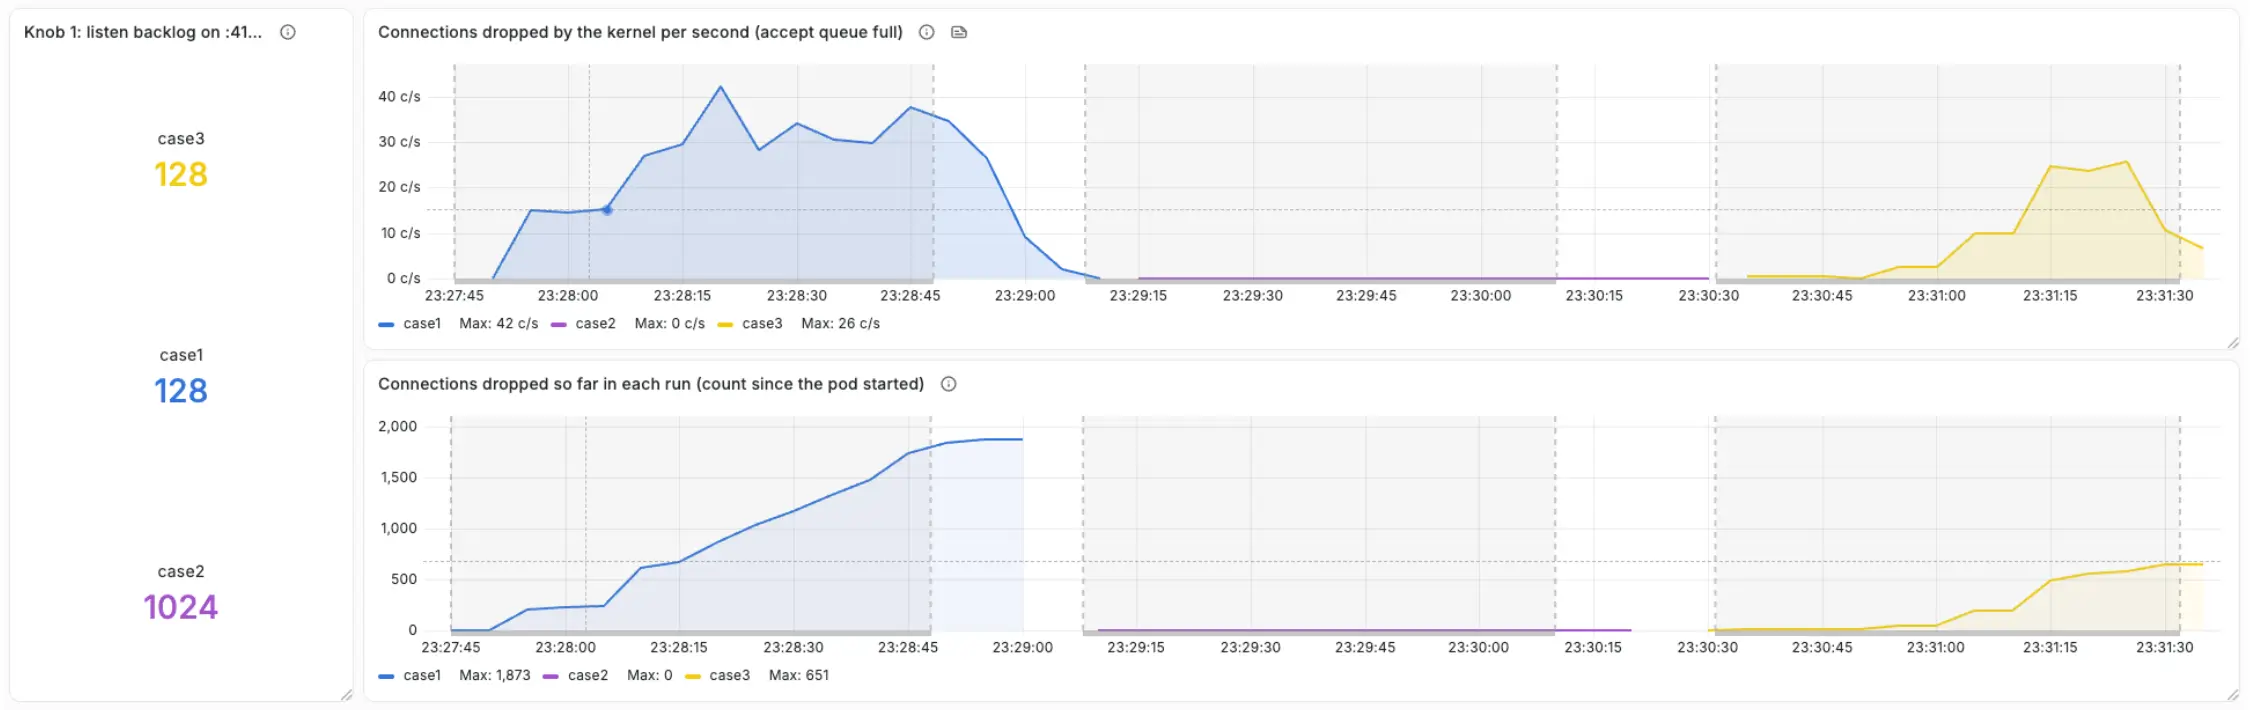
Start with the listen backlog and the two kernel-drop panels. These show what happens at the listener, before the proxy can process an HTTP request.
With a backlog of 128 and one worker, the kernel records drops during the test. Increasing the backlog to 1024 while keeping one worker brings the recorded drops to zero. The larger queue gives incoming connections more room to wait while the proxy catches up.
With four workers and the original backlog of 128, drops still occur. Adding workers changes how quickly the proxy can accept and process connections, but it does not enlarge the queue in front of it. A small backlog can still fill during bursts.
The distinction matters: eliminating listener drops tells us that this buffer was sufficient for the run. It does not tell us whether the proxy had enough processing capacity or whether every client request completed before its deadline. For that, we need to look at the next layer.
Layer 2: the proxy runtime
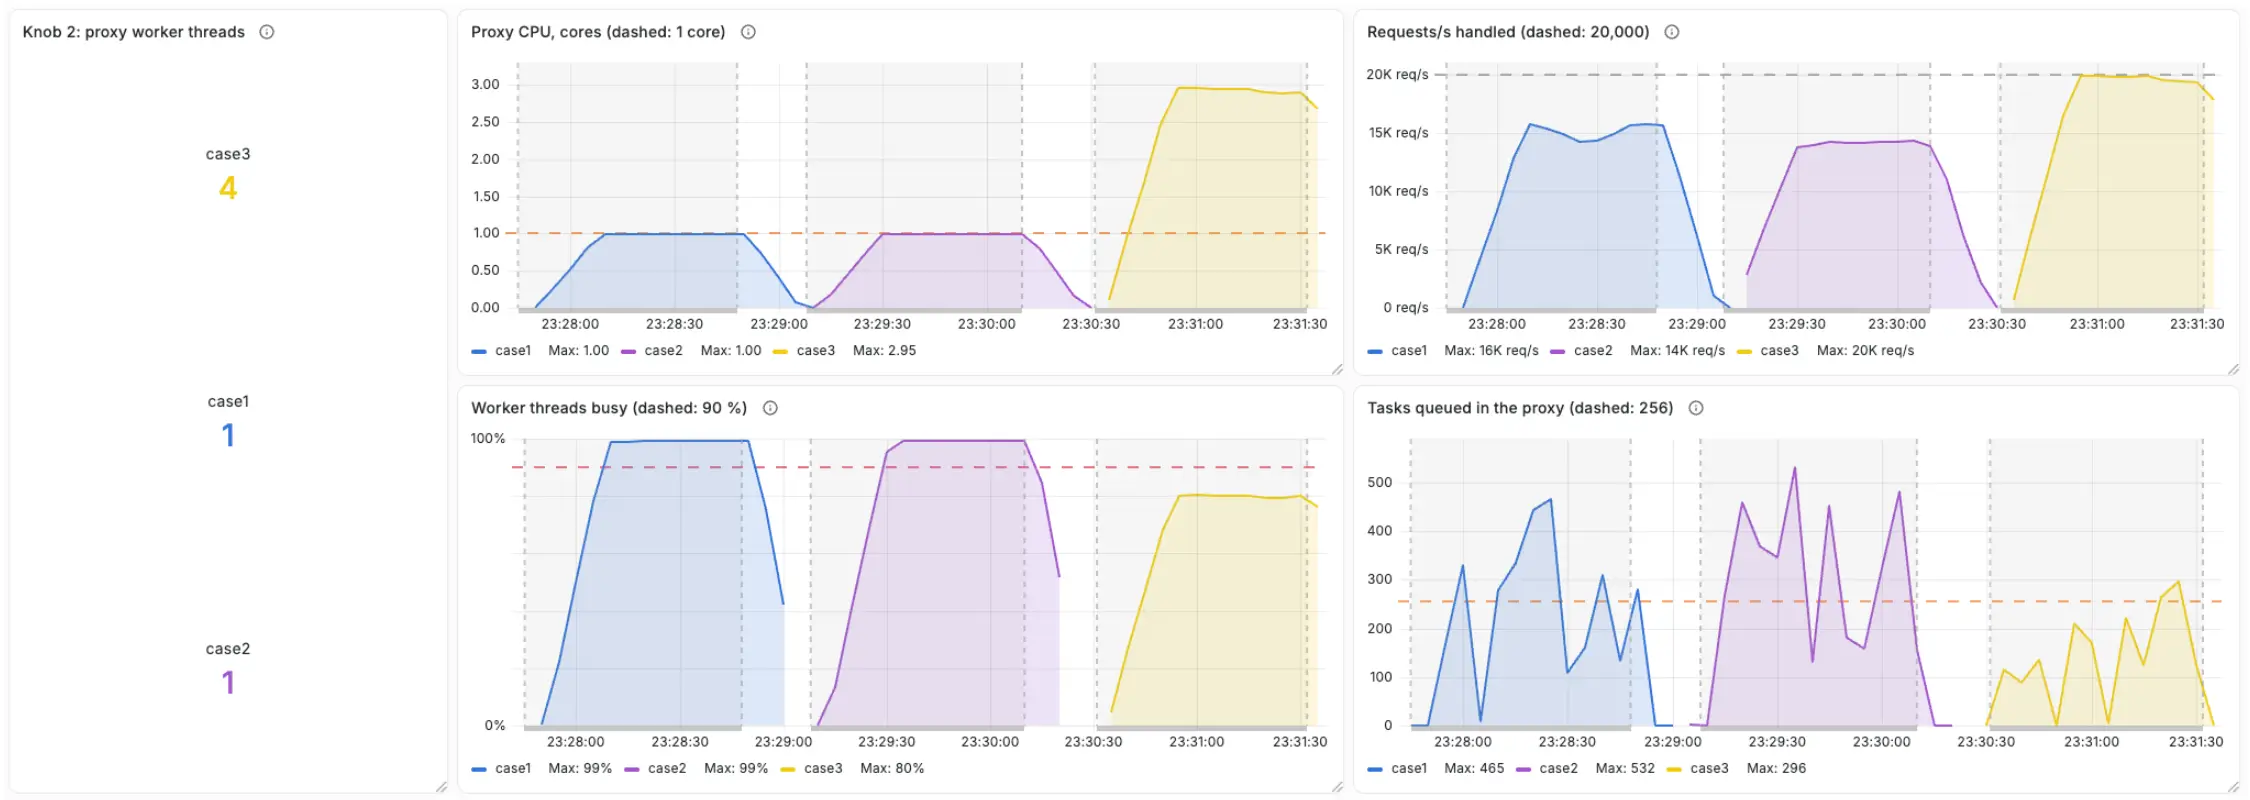
Now look at worker busyness, queued tasks, CPU usage, and handled requests per second.
Both single-worker runs show the same capacity constraint. The worker stays close to fully busy, CPU usage levels off at approximately one core, and hundreds of tasks accumulate in the runtime. Increasing the listen backlog does not relieve that pressure: the purple run still has one worker doing the work.
With four workers, the picture changes. The proxy uses close to three CPU cores during the load, worker busyness is lower, and the handled request rate approaches the 20,000 requests per second target.
These panels show why the two settings are not interchangeable. A larger backlog provides more waiting room at the kernel layer. Additional workers allow more runtime work to execute concurrently, provided CPU capacity is available.
Putting both layers together: what the client experienced
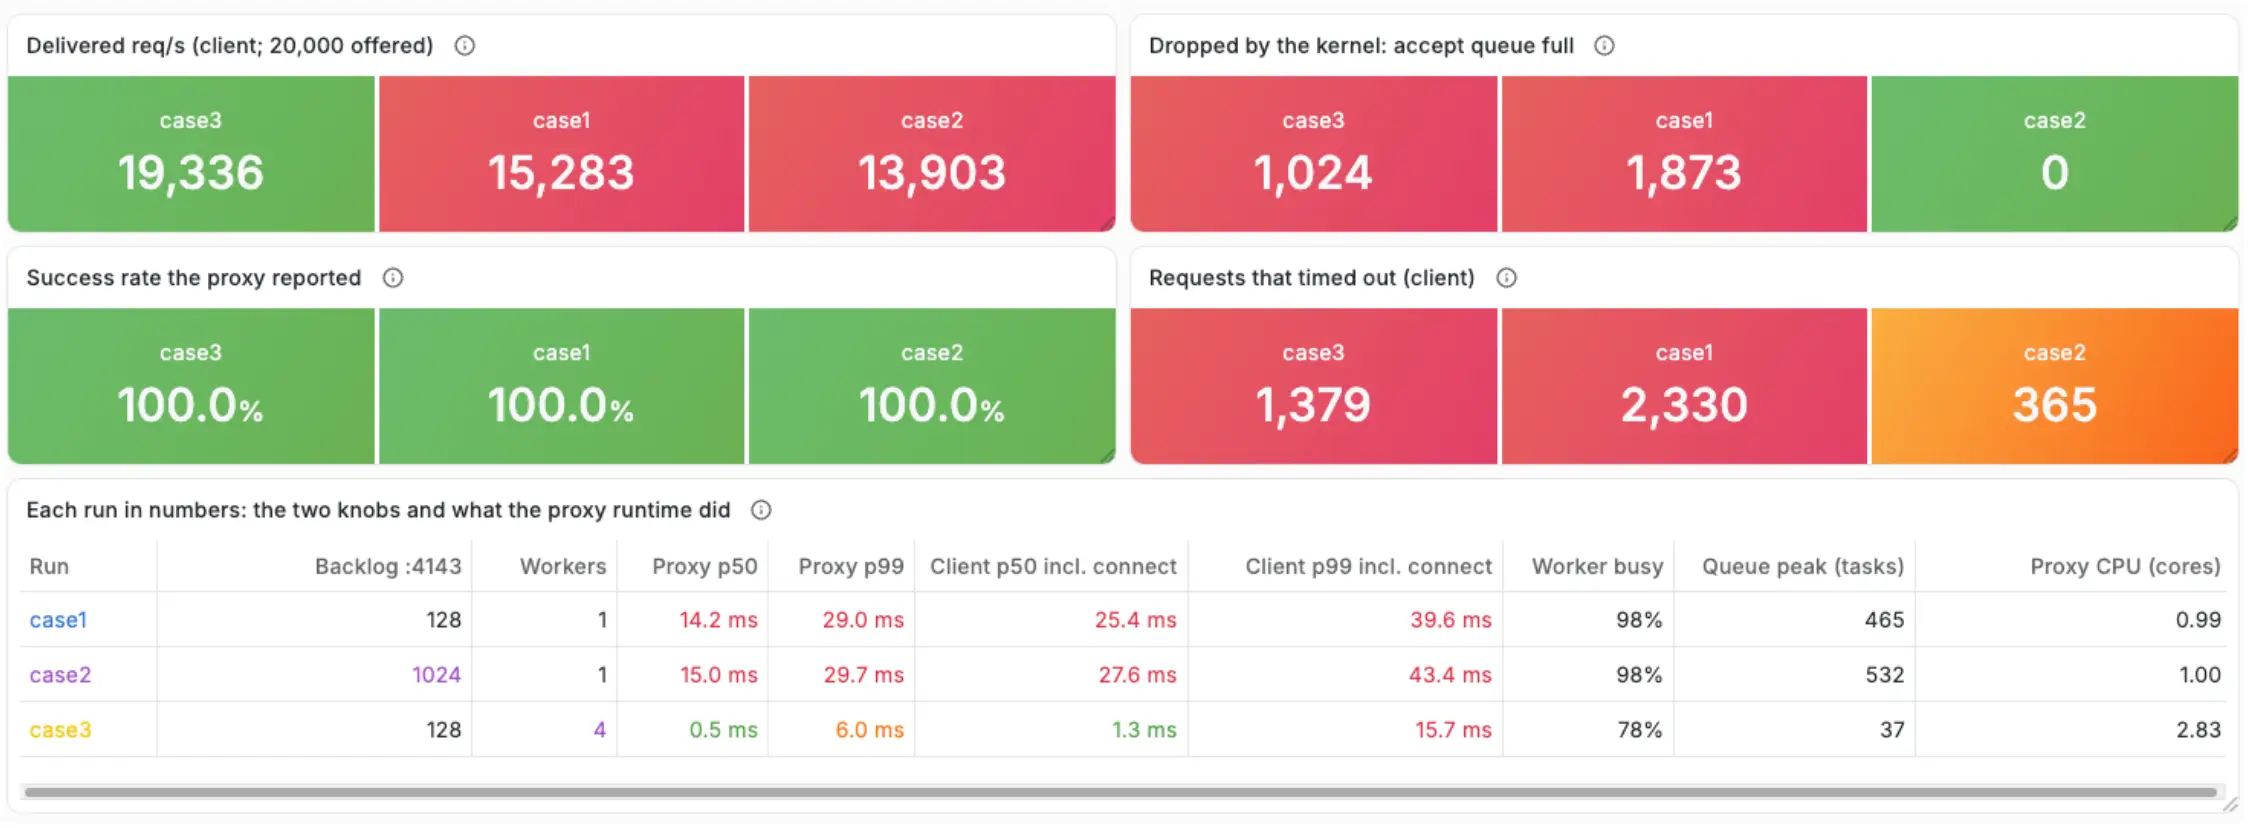
The final panel connects these resource-level signals to the client’s results.
The larger backlog eliminates recorded kernel drops, but it does not increase delivered throughput in this test. The client records 15,283 requests per second with the baseline configuration and 13,903 with the larger backlog. Timeouts fall from 2,330 to 365, but they do not disappear. Removing one source of failure is not the same as removing every source of delay.
With four workers, delivered throughput rises to 19,336 requests per second. Client p50 latency falls from 25.4 ms to 1.3 ms, and p99 falls from 39.6 ms to 15.7 ms. However, the client still records 1,379 timeouts, so this configuration improves throughput and latency without fully resolving the failures.
Meanwhile, the proxy reports a 100% success rate in all three runs. That percentage describes the responses included in the proxy’s success-rate calculation—not every attempt made by the client. Connection failures before an HTTP request reaches the proxy are outside that measurement.
Read the layers together: the kernel panels reveal listener pressure, the runtime panels reveal processing pressure, and the client results show the outcome. The backlog controls how much can wait; the workers help determine how quickly that work can move forward.
Conclusion
The two layers address different kinds of pressure. The accept queue buffers incoming connections while they wait for the proxy to accept them. The workers provide processing capacity, helping the proxy keep up with incoming traffic.
In these tests, increasing the backlog eliminated recorded kernel drops, but the single worker remained saturated and throughput did not improve. Adding workers increased throughput and reduced latency, but some kernel drops and client timeouts remained with the default backlog.
Which setting you need depends on both your traffic’s burstiness and the proxy’s ability to sustain the incoming load. Use the kernel metrics to identify listener pressure, the runtime metrics to identify worker saturation, and the client’s results to confirm whether the changes actually improved the experience.
FAQ
Why is Linkerd's proxy success rate 100% while clients report connection timeouts?
When the kernel's accept queue is full, it drops the SYN before the proxy ever sees the connection. The client logs a connect timeout, but the proxy never measured that request, so its success rate metric stays at 100%. Check TcpExtListenOverflows instead.
Should you raise the backlog or add workers to fix connection timeouts?
It depends on the problem. A deeper backlog buffers short traffic bursts so connections wait instead of getting dropped. More workers add sustained capacity so the queue drains faster. Use backlog for bursts and workers for a sustained ceiling.
Why does a Linkerd proxy use only 1 core on a 64-core node?
Without an explicit CPU limit, the proxy falls back to proxy.runtime.workers.minimum, which defaults to 1 worker no matter how many cores the node has. Set config.linkerd.io/proxy-cpu-limit or proxy-cpu-ratio-limit to use more of the node.
What is the TCP listener backlog in a meshed Kubernetes pod?
It's the kernel's accept queue in front of the proxy's inbound listener, where established connections wait to be processed. Once a pod is meshed, iptables redirects traffic to the proxy, so its backlog (default 128) governs the pod, not the app's own setting.
How do you size Linkerd proxy workers across nodes with different CPU counts?
Use the config.linkerd.io/proxy-cpu-ratio-limit annotation instead of a fixed CPU limit. It sets worker count as a fraction of each node's cores, so a 0.25 ratio gives 1 worker on a 4 vCPU node and 4 workers on a 16 vCPU node.