

Debugging Linkerd: A Field Guide to the Errors You'll Actually See


Ivan Porta
June 18, 2026
At some point, something in your cluster will go wrong. Requests might start failing, proxies might stop being injected, latency might increase, or you might start seeing unexpected HTTP status codes, such as 504s. Since Linkerd sits in the middle of every meshed workload and handles every connection going through it, it’s often where failures show up first. Most of the time, though, it’s just exposing errors caused by something else.
The mesh gives you a lot of signal. Layer 4 and Layer 7 logs and metrics for every hop, which you can stitch together into a picture of what’s actually happening. This guide walks through the failures you'll actually hit operating Linkerd, what each one is really telling you, and the commands to confirm it.
Begin with the basics: health checks, proxy logs, and metrics
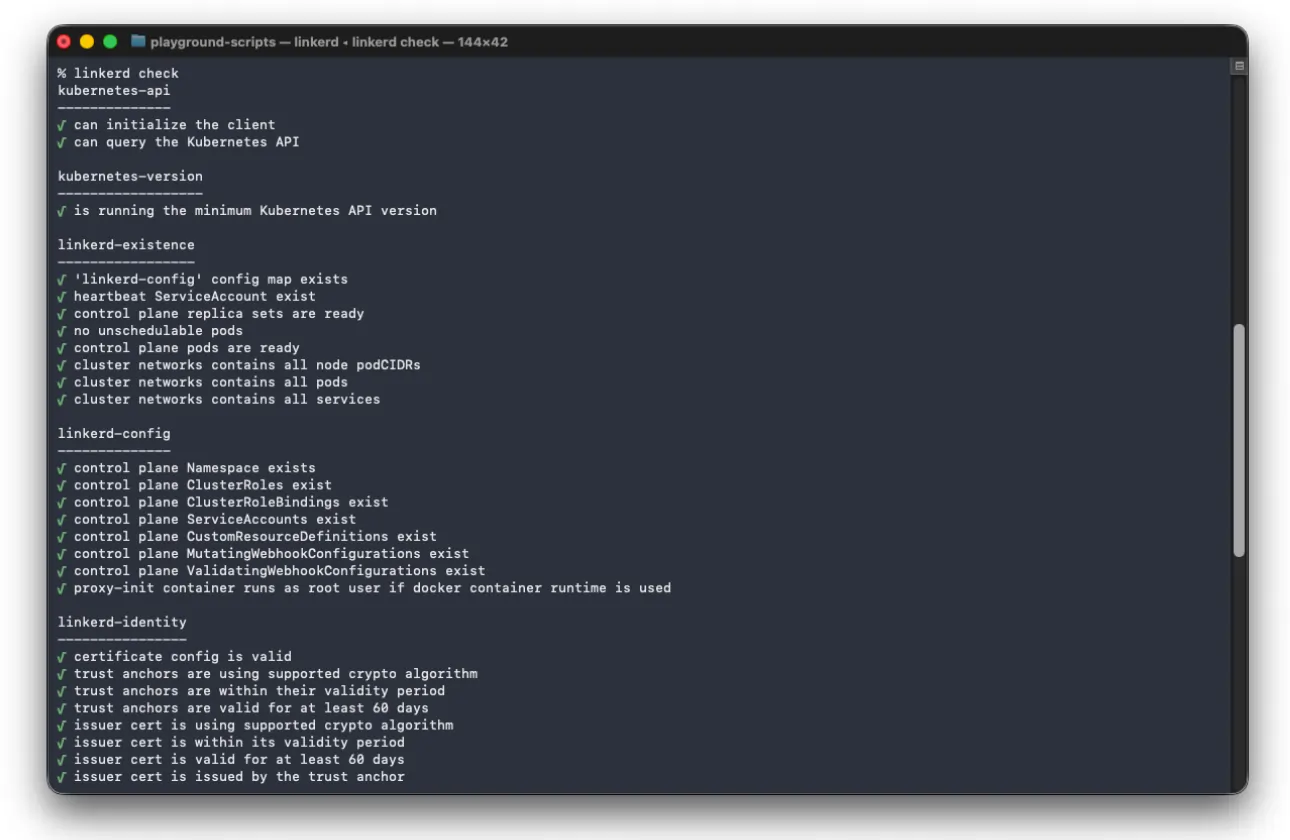
Engineers, myself included, often dive straight into reviewing logs, packets, and network settings. But there’s one command that’s often overlooked and is a great starting point for troubleshooting: linkerd check.
This Linkerd CLI command validates many parts of the service mesh, such as trust anchor validity, identity issuer, control plane, RBAC settings, webhooks, and any installed extensions like multicluster. If linkerd check does not pass, it means something needs to be fixed before you look further. Running this command first helps you quickly rule out many possible causes and focus your troubleshooting.
Let’s assume you need to dig deep into the logs and inspect a live incident without restarting a pod showing unexpected behavior. By default, the proxy uses info level logging and hides information not relevant during normal operations but useful during troubleshooting. You can change the log level at runtime through the proxy’s admin endpoint on port 4191. Port-forward the admin port and PUT and increase the verbosity:
kubectl port-forward ${POD} linkerd-admin
curl -X PUT --data 'linkerd=debug' localhost:4191/proxy-log-level
This command becomes even more helpful if used with the single crate verbosity. You can selectively increase the verbosity of specific crate used by the proxy while leaving others at a higher verbosity, making troubleshooting easier. For example, if you're chasing a load-balancing or protocol-detection problem, raise the level on just that crate and leave the rest at info. Some useful crates are hickory (DNS resolver) and linkerd_proxy_balance (Load balancing/pools). This is documented in Modifying the Proxy Log Level.
.webp)
In addition to the global check of the Linkerd CLI and dynamic log verbosity of the proxy, we can find the metrics. By default, the proxy exposes Prometheus-format metrics at /metrics on port 4191. These cover layer 7 data such as request and response totals, latency buckets, and route-level data; layer 4 TCP with connection counts; and control plane health like certificate expiry.
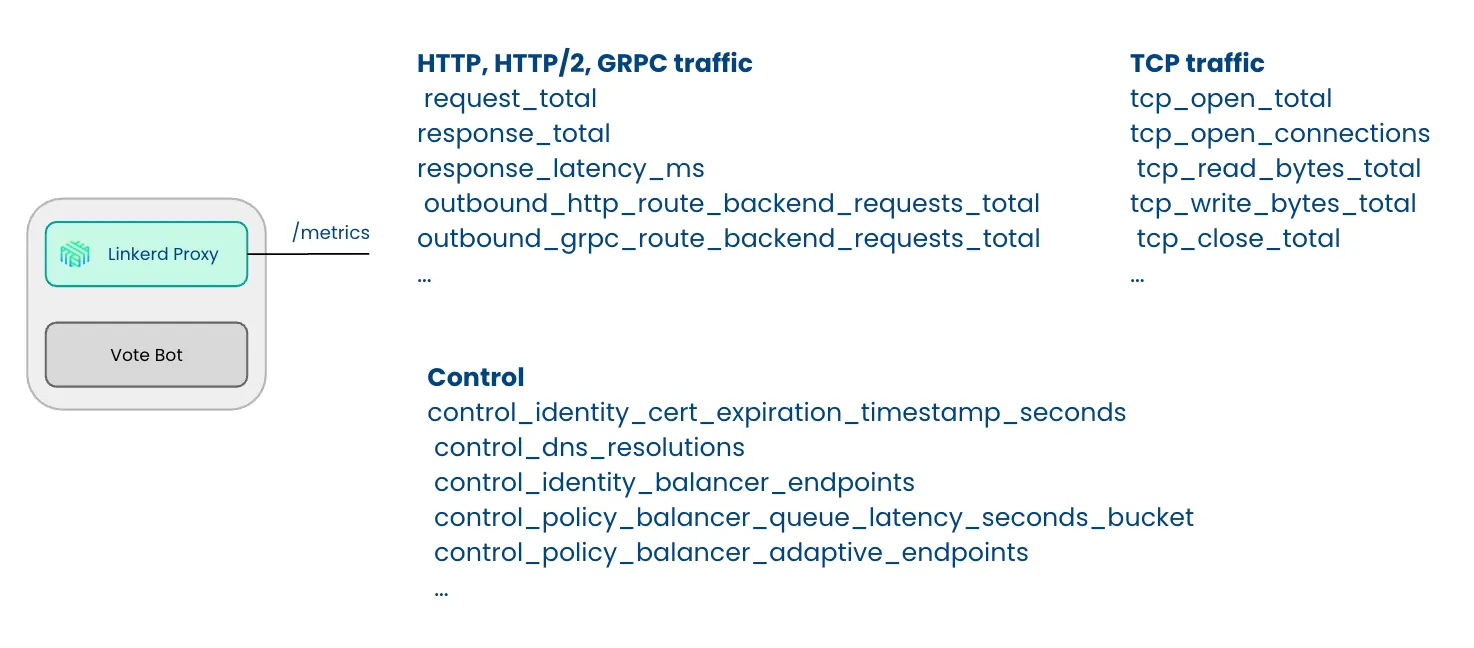
To access them without a scraper, you can port forward the pod on port 4191 and curl the /metrics endpoint. However, the linkerd diagnostics proxy-metrics ${POD} makes things easier by fetching them for you without the port-forward step. Two other linkerd diagnostics subcommands earn their keep. linkerd diagnostics endpoints show exactly which endpoints a given proxy can see. linkerd diagnostics policy is what you use when HTTPRoutes or traffic splitting aren't behaving. (See the proxy metrics reference for the full list.)
.webp)
Now that we have defined some strategies to troubleshoot the mesh, let’s move forward with some common pitfalls.
The port that can break every meshed request
Starting with enterprise-2.18.0, Linkerd redirects all inbound traffic to the proxy on port 4143 and all outbound traffic on port 4140. The key fact is that traffic between two meshed proxies always crosses the inbound port, 4143, in both directions, regardless of the application port underneath.
That last detail is where people get burned. Take a common setup: a strict default-deny posture where network policies permit only specific application ports between workloads. You allow the client to reach the server on 8080, the app's port, and expect traffic to flow. However, it does not. The problem is that under the hood, the client's proxy connects to the server's proxy on 4143, and that connection is blocked by either NetworkPolicy or CiliumNetworkPolicy. You see a flood of requests leave the client while nothing arrives at the server, followed by fail-fast errors.
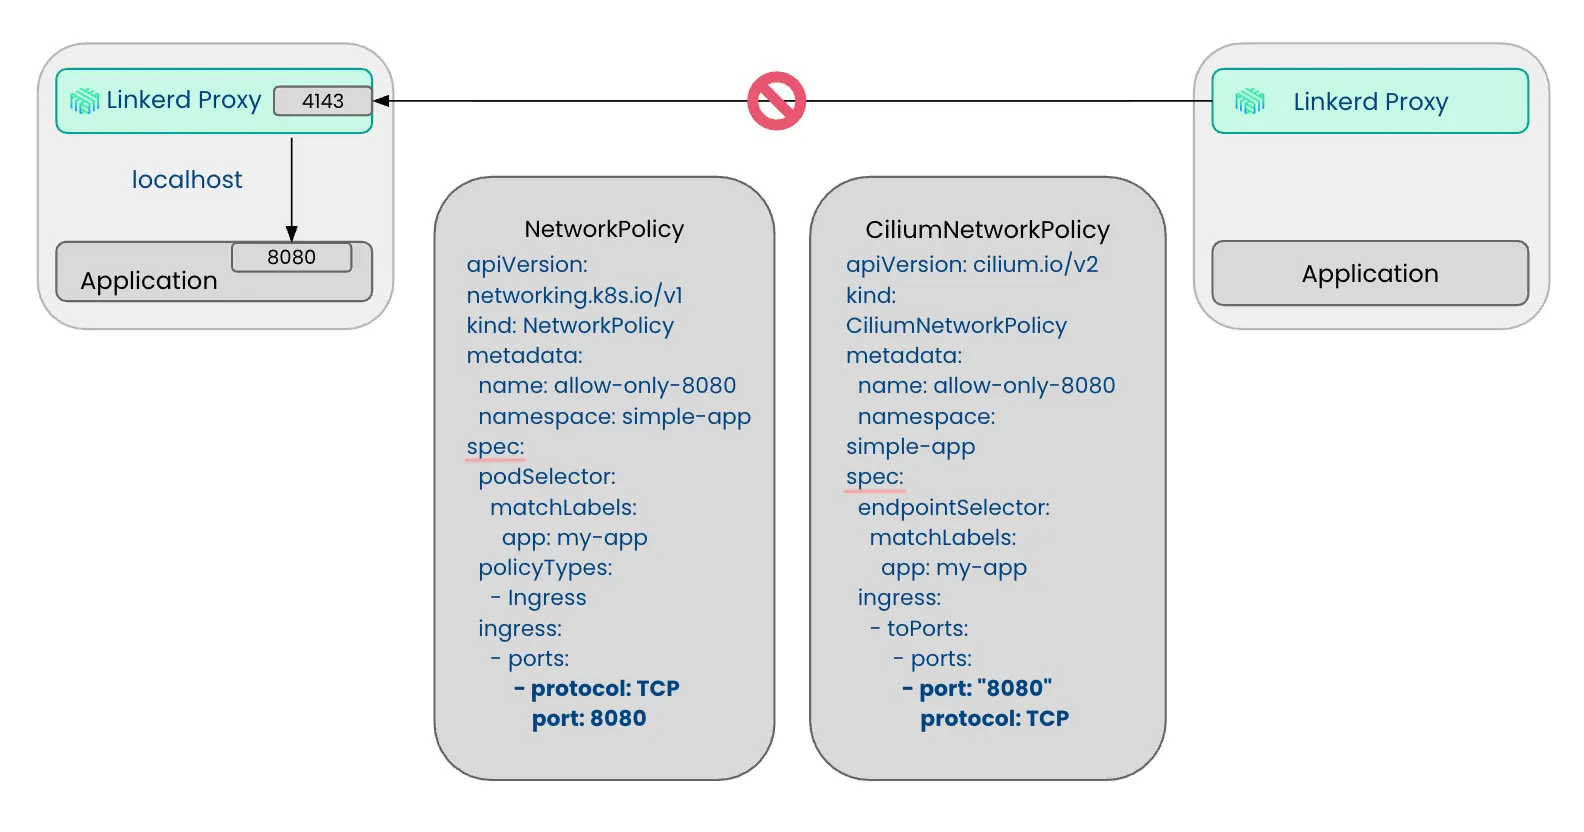
The solution is straightforward: adding port 4143 to the list of allowed ports.
Why some TCP connections pause for 10 seconds
If not explicitly marked as opaque, the proxy checks the first few bytes of each connection to figure out which protocol to use, so you don’t have to specify every protocol in advance. This approach means most connections work out of the box without extra setup.
The problem comes up when no bytes are sent, like server-speaks-first protocols like NATS, SMTP and MySQL. In these cases, the proxy waits for client data that never comes and, after 10 seconds stops waiting and treats the connection as plain TCP. While this is not causing disruptions to the flow, it introduces a 10-second connection delay.
.webp)
This behavior is easily identifiable in the proxy logs, where you will see messages similar to the following:
[  1267.198753s] DEBUG ThreadId(01) outbound:proxy{addr=10.43.163.235:8080}: linkerd_http_detect: Detected result=Ok(ReadTimeout(10s)) elapsed=10.001082629s
[  1267.198830s]  INFO ThreadId(01) outbound:proxy{addr=10.43.163.235:8080}: linkerd_app_outbound::protocol: Continuing after timeout: 10s
To prevent this delay, you can instruct the proxy to use TCP directly and skip protocol detection for connections to specific ports. This can be configured either through the config.linkerd.io/opaque-ports annotation on the pod specification or by declaring the protocol on the Service using appProtocol. For example:
apiVersion: v1
apiVersion: v1
kind: Service
metadata:
 name: nats
 namespace: nats-system
spec:
 ports:
 - appProtocol: tcp
   name: nats
   port: 4222
   protocol: TCP
   targetPort: nats
Fail-fast is a symptom, not a root cause
Fail fast is one of the most misunderstood errors. It does not mean Linkerd itself failed. Instead, it means the proxy's load balancer for that service could not become ready within the fail-fast timeout, usually because there are no ready endpoints available. Rather than letting requests build up for a service with nowhere to send them, the proxy rejects them right away. Fail fast stops as soon as the balancer has a usable endpoint again, which typically happens when the destination controller provides healthy ones. In the client's proxy logs, you will see messages like these:
[    49.103125s]  INFO ThreadId(01) outbound:proxy{addr=10.43.38.167:8080}:service{ns=playground name=playground-server-http port=8080}: linkerd_proxy_balance_queue::worker: Unavailable; entering failfast timeout=3.0
[    49.103266s]  INFO ThreadId(01) outbound:proxy{addr=10.43.38.167:8080}:rescue{client.addr=10.42.1.21:37866}: linkerd_app_core::errors::respond: HTTP/1.1 request failed error=logical service 10.43.38.167:8080: route default.http: backend Service.playground.playground-server-http:8080: Service.playground.playground-server-http:8080: service in fail-fast error.sources=[route default.http: backend Service.playground.playground-server-http:8080: Service.playground.playground-server-http:8080: service in fail-fast, backend Service.playground.playground-server-http:8080: Service.playground.playground-server-http:8080: service in fail-fast, Service.playground.playground-server-http:8080: service in fail-fast, service in fail-fast]
So if you see this error, check what's happening behind the service. Here are the most common causes:
- The workload might be unhealthy. For example, a new release stuck in
CrashLoopBackOffis a common issue. Sometimes you spend an hour debugging the client before realizing the server never started. - Another cause is when replicas are scaled to zero. If there are no pods, there are no endpoints.
- Sometimes the label selector is wrong. The workload is healthy, but if someone changes a Service's selector, it might not match the pods anymore.
- Readiness probes might be failing. When this happens, Kubernetes marks the pods as not ready and removes them from the endpoint set.
How to tell whether a 503 came from Linkerd or your app
When you see a 503 error, it’s easy to start looking for missing endpoints, reviewing the Linkerd destination controller logs, proxy logs, metrics, and more, assuming that the mesh is not working as expected. However, one of the most common reasons is simple: your application returned the 503, and the proxy simply passed it along.
Linkerd provides a clear way to tell the difference. If the proxy generates an error response, it sets the l5d-proxy-error header. If it’s absent and you’re still seeing a 503, the status code came from your application. For example, in this case, even if the client’s proxy is getting 503, we can see that there is no l5d-proxy-error. Additionally, the presence of x-mesh-client-id confirms that mTLS is working, so the next steps should be debugging the application itself.
< HTTP/1.1 503 Service Unavailable
< x-mesh-client-id: playground-client.playground.serviceaccount.identity.linkerd.cluster.local
< x-request-count: 65
< x-served-by: playground-server-http-primary-9d9566587-xhsrl
If the mesh is failing, the l5d-proxy-errorheader will be present. For example, in case of fail fast we will see the following:
< HTTP/1.1 504 Gateway Timeout
< l5d-proxy-error: logical service 10.43.38.167:8080: route default.http: backend Service.playground.playground-server-http:8080: Service.playground.playground-server-http:8080: service in fail-fast
< l5d-proxy-connection: close
When old ServiceProfiles override new HTTPRoutes
Here's a migration gotcha that looks like a bug. You're moving traffic management from the older ServiceProfile resource to Gateway API HTTPRoutes. You might apply an HTTPRoute to send all traffic to your canary and delete the ServiceProfile, yet some traffic keeps landing on the primary. The routing does not match what you set up.
This happens because of how the proxy chooses between the two options. For each destination, it resolves both the ServiceProfile and the HTTPRoute in parallel, giving priority to the ServiceProfile when it defines routes or a traffic split. When a proxy starts and finds a ServiceProfile attached to a destination, it flips into ServiceProfile mode for that destination and keeps using it until the cache is evicted or the pod is restarted. However, under heavy load, that eviction may not happen, causing the proxy to keep honoring the ServiceProfile.
.webp)
Depending if the proxy is honoring ServiceProfile or HTTPRoute you will see log messages like the following:
[ 311.996693s] DEBUG ThreadId(01) outbound:accept{client.addr=10.23.0.19:35388 server.addr=10.247.65.191:80}:proxy{addr=10.247.65.191:80}: linkerd_app_outbound::sidecar: Using ServiceProfile
[ 147.873432s] DEBUG ThreadId(01) outbound:accept{client.addr=10.23.0.19:38668 server.addr=10.247.65.191:80}:proxy{addr=10.247.65.191:80}: linkerd_app_outbound::sidecar: Using ClientPolicy routesThat precedence is a deliberate design choice from the Gateway API work, in the name of least surprise: an HTTPRoute someone applies shouldn't silently seize control of traffic from an existing ServiceProfile. The practical advice is to do the cutover in development first. Delete the ServiceProfile, recreate the equivalent behavior as HTTPRoute, restart, and confirm everything works before you touch production. If you're starting fresh today, go straight to HTTPRoute. Header manipulation and path-based routing alone are worth it.
The expired certificate problem that creates unmeshed pods
To validate and inject proxies, Linkerd control planes use two validating webhooks and one mutating webhook. These webhooks communicate with the API server over TLS, so they need a certificate. When you install Linkerd with Helm or the CLI, it creates a self-signed certificate for the webhook's CA bundle that is valid for 365 days.
If you don't rotate the certificate or upgrade Linkerd within a year, the certificate will expire. The good news is that this doesn't affect the data plane. Existing proxies keep running and handling traffic. The downside is less obvious. For the proxy-injector mutation webhooks, when a new pod is created, the call to the proxy injector fails because of the expired certificate. Since the webhook's failurePolicy is set to Ignore by default, Kubernetes skips the injection and schedules the pod anyway. The pod starts up healthy but without the mesh. You have two options. If you prefer to fail loudly instead of failing open, set the webhook failurePolicy to Fail. This way will block pod creation completely, and you'll see a ReplicaSet stuck at the desired number of pods but with zero running. At least this makes the issue clear:
webhooks:
  - name: linkerd-proxy-injector.linkerd.io
    failurePolicy: Fail
The better lever is to not let the cert expire at all. Use cert-manager to rotate the webhook certificate automatically, which removes the manual bundle juggling and the calendar reminder you'll inevitably miss.
Frequently Asked Questions
What should I check first when Linkerd traffic starts failing?
Run linkerd check first. It validates the control plane, certs, webhooks, RBAC, and extensions in one command. If it fails, fix what it reports before looking at logs or metrics.
Why am I seeing fail-fast errors in Linkerd?
Fail-fast means the proxy has no ready endpoints for a service. Check that pods are running, replicas aren't scaled to zero, readiness probes are passing, and the Service label selector matches your pods.
Why are some connections delayed by exactly 10 seconds?
Linkerd waits up to 10 seconds to detect the protocol on a new connection. Server-speaks-first protocols like NATS, SMTP, and MySQL trigger this. Fix it by setting appProtocol: tcp on the Service or marking the port as opaque.
How can I tell if a 503 came from Linkerd or my application?
Check for the l5d-proxy-error header in the response. If it's present, the error came from the proxy. If it's absent, the 503 came from your app and the proxy just passed it through.
Why are new pods starting without a Linkerd sidecar?
The proxy-injector webhook cert may be expired. With failurePolicy: Ignore (the default), Kubernetes skips injection and starts the pod without the sidecar. Use cert-manager to auto-rotate the cert and avoid this.


