Circuit Breaking in Linkerd: Isolating Failing Endpoints Without Taking Down the Service


.webp)
September 30, 2026
Circuit breaking is a software design pattern that mimics the circuit breaker in your home. In your home, plugging in too many appliances on one circuit causes the breaker to trip, turning off power to that particular circuit while leaving the rest of your house unaffected. In Kubernetes environments, Linkerd’s circuit breaker functionality turns off traffic to pods that are failing, leaving the microservice as a whole still running.
Prerequisite: Circuit Breaking is available in Linkerd 2.13 and later, in both the open source and Buoyant Enterprise Linkerd (BEL) editions. The following prerequisites must be in place before starting:
- A Kubernetes cluster (this tutorial was validated on k3d)
- The Gateway API CRDs installed required by Linkerd
- Buoyant Enterprise Linkerd (BEL) 2.19.7 or later installed, with the
linkerd vizextension - The
linkerdCLI andkubectl
This tutorial was validated with BEL 2.19.7 on a k3d cluster.
How a failing pod escapes Kubernetes health checks
Imagine a typical deployment with three replicas. Two pods are responding in the expected manner, returning HTTP 200s in milliseconds, but the third pod is failing almost every request.This can happen for all kinds of reasons. Maybe the pod got a combination of inputs that broke its state machine; maybe its connection to a database went down.
The difficult part is that Kubernetes might not even notice the failure. It’s all too common for pods to get into states where they cannot respond to service traffic, but do still respond happily to the kubelet’s readiness probe. This means Kubernetes keeps reporting a degraded pod as “Ready”.
Meanwhile, the customer success team is receiving reports of intermittent failures, because whenever a user’s request is routed to a healthy pod, everything works. It’s just the minority of traffic going to the unhealthy pod that fails.
Treating the entire service as unavailable isn’t exactly right: it’s still mostly working. Worse, pulling the entire service down might trigger cascading failures upstream. We just need to skip routing to the failing endpoint for the entire service to become healthy again.
Circuit Breaking in Linkerd
Circuit breaking works in one of two ways: it can break the circuit when the success rate drops too low or when there are too many consecutive failures. In either case, you can configure which HTTP or gRPC response status codes are considered failures.
When circuit breaking is triggered , the circuit breaking will put the endpoint in “probation”. Linkerd will temporarily remove the degraded pod, place it in a “time out”, and then make it available to handle a single piece of real traffic (called a probe request). If the request succeeds, the endpoint is no longer considered failing, and removed from probation. However, if the request does not succeed then the endpoint will remain unavailable.
Demonstrating Circuit Breaking
We’ll demonstrate circuit breaking using bb and slow_cooker, both from Buoyant. bb is a backend service that can simulate failures, and slow_cooker is a load generator.
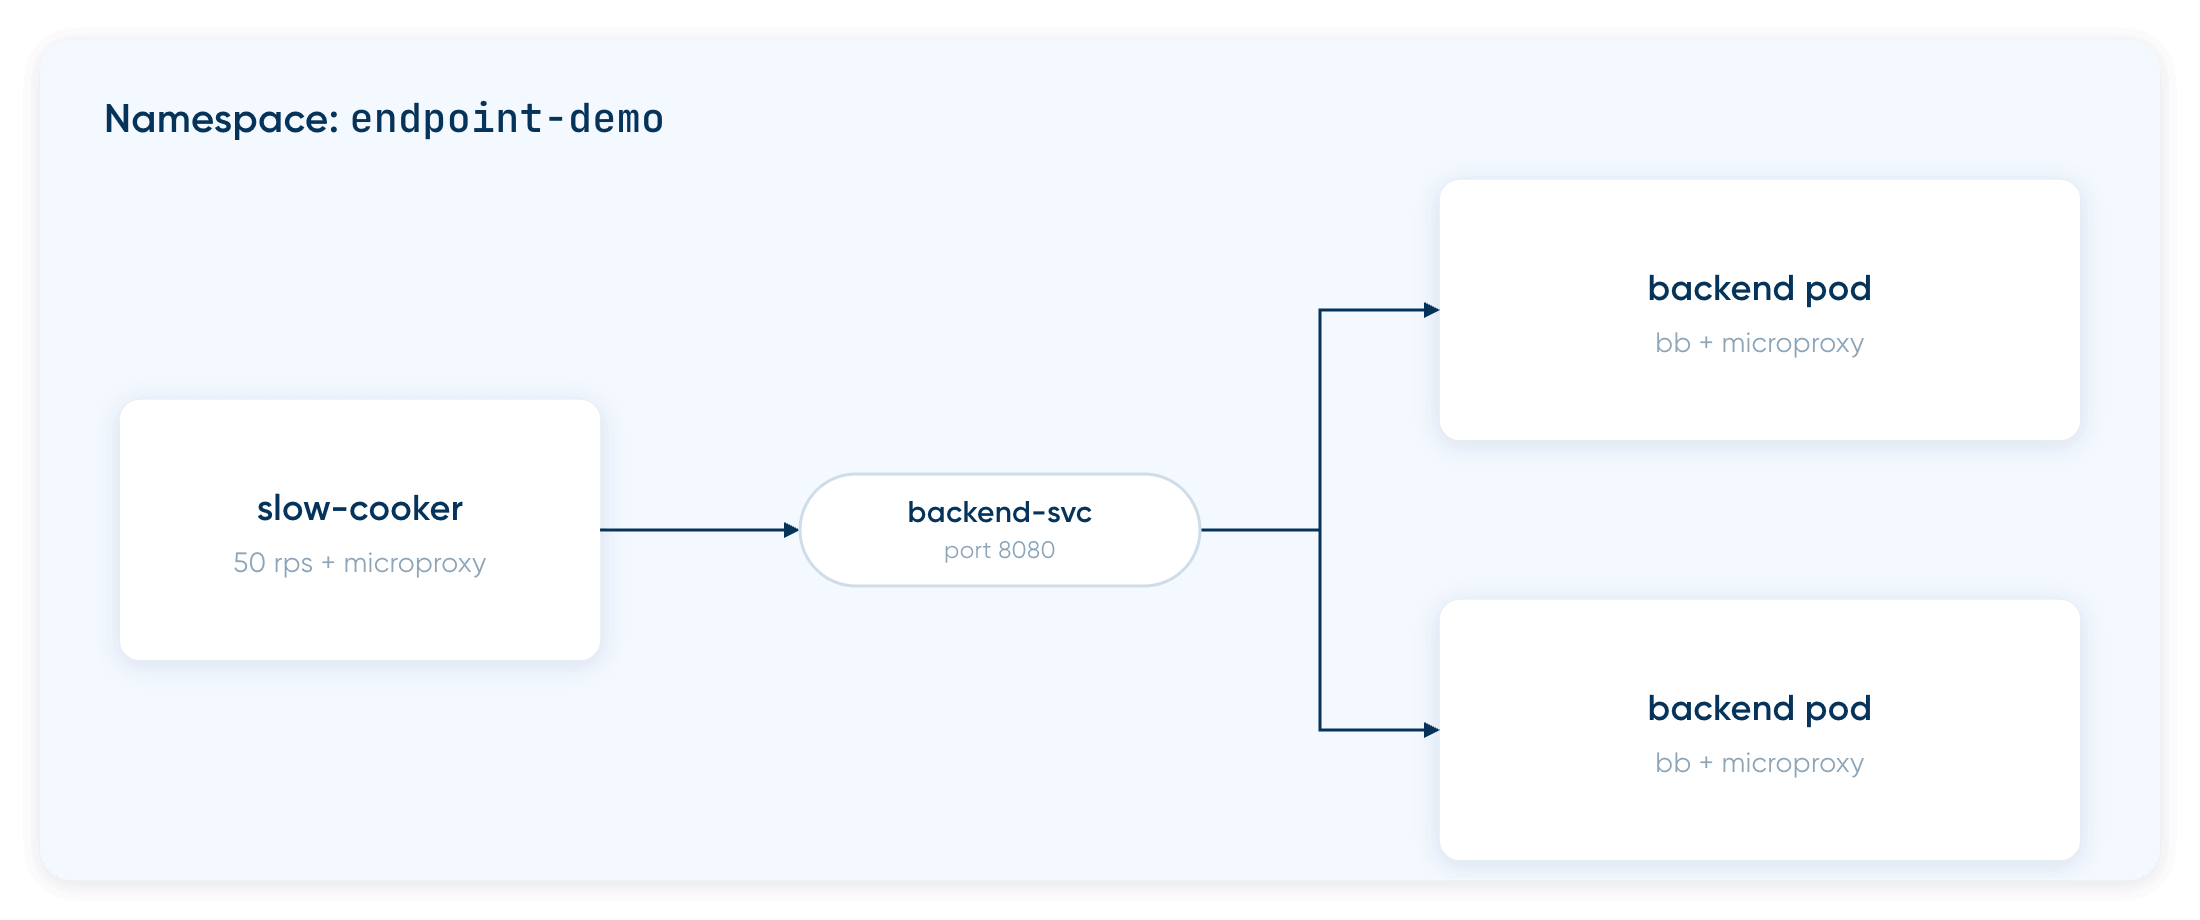
1. Setting up the namespace and the backend
Start by making a demo namespace. We’ll tell Linkerd to automatically inject every Pod in this namespace to make our lives easier.
kubectl create namespace endpoint-demo
kubectl annotate ns/endpoint-demo linkerd.io/inject=enabled
Next, deploy 2 healthy backend replicas of the buoyant/bb configured to return 100% success.
Note: Make sure that the requirements in the prerequisites above are installed.
kubectl apply -f - <<EOF
apiVersion: apps/v1
kind: Deployment
metadata:
  name: backend
  namespace: endpoint-demo
spec:
  replicas: 2
  selector:
    matchLabels:
      app: backend
  template:
    metadata:
      labels:
        app: backend
    spec:
      containers:
      - name: backend
        image: buoyantio/bb:v0.0.7
        args:
          - terminus
          - "--h1-server-port=8080"
          - "--percent-failure=0"
        ports:
        - containerPort: 8080
---
apiVersion: v1
kind: Service
metadata:
  name: backend-svc
  namespace: endpoint-demo
spec:
  selector:
    app: backend
  ports:
  - port: 8080
    targetPort: 8080
EOF
You can check that both pods are in “Running” status with the following command:
kubectl get pods -n endpoint-demo -w
NAME                       READY   STATUS    RESTARTS   AGE
backend-66f4c7cf47-clmnw   2/2     Running   0          23s
backend-66f4c7cf47-dxczj   2/2     Running   0          23s
This shows both the application container (bb), as well as the Linkerd side proxy.
This reflects the application container plus the Linkerd sidecar proxy injected by linkerd inject.
2. Adding the load generator
With the backend running, deploy slow_cooker to generate a steady stream of 50 requests per second toward backend-svc. Inject the proxy here as well so Linkerd can observe the outbound requests:
kubectl apply -f - <<EOF
apiVersion: apps/v1
kind: Deployment
metadata:
  name: slow-cooker
  namespace: endpoint-demo
spec:
  replicas: 1
  selector:
    matchLabels:
      app: slow-cooker
  template:
    metadata:
      labels:
        app: slow-cooker
    spec:
      containers:
        - name: slow-cooker
          image: buoyantio/slow_cooker:1.3.0
          args:
            - "-qps"
            - "50"
            - "-concurrency"
            - "2"
            - "http://backend-svc:8080"
EOF
The -concurrency 2 flag tells slow_cooker to keep two requests in flight simultaneously. This affects the total observed response per second (RPS) and the connection slot counts you'll see in the balancer metrics later.
Within a few seconds, slow_cooker starts sending 50 req/s to backend-svc.
3. Verifying the healthy baseline
Check the live traffic stats:
linkerd viz stat deploy -n endpoint-demo
  NAME          MESHED   SUCCESS      RPS   LATENCY_P50   LATENCY_P95   LATENCY_P99   TCP_CONN
  backend          2/2   100.00%   36.9rps           1ms           1ms           1ms          8
  slow-cooker      1/1   100.00%     0.0rps           1ms           1ms           1ms          2
linkerd viz stat deploy shows inbound traffic per deployment. slow-cooker is a pure client that sends requests but receives none from other services in this demo, so its inbound request per second (RPS) is zero. The 100% SUCCESS column reflects its outbound calls succeeding.
4. Introducing the failing pod
To simulate the silently broken pod scenario, deploy a second deployment with the same app: backend label. The service will automatically add this pod to the endpoint pool without knowing it returns only errors.
Using a second deployment allows us to observe the two groups separately with linkerd viz. It’s just a way of more easily seeing which traffic is failing and which is not, while still collecting everything into a single Service.
kubectl apply -f - <<EOF
apiVersion: apps/v1
kind: Deployment
metadata:
  name: backend-bad
  namespace: endpoint-demo
spec:
  replicas: 1
  selector:
    matchLabels:
      app: backend
      fault: "true"
  template:
    metadata:
      labels:
        app: backend
        fault: "true"
    spec:
      containers:
        - name: backend
          image: buoyantio/bb:v0.0.7
          args:
            - terminus
            - "--h1-server-port=8080"
            - "--percent-failure=100"
          ports:
            - containerPort: 8080
EOF
The Service now has three endpoints: two healthy and one returning HTTP 500 on all requests. From Kubernetes perspective, all three pods appear as running.
What happens without failure accrual
Without failure accrual configured, run `linkerd viz stat deploy -n endpoint-demo` right after injecting the degraded pod:
linkerd viz stat deploy -n endpoint-demo
NAME          MESHED   SUCCESS       RPS   LATENCY_P50   LATENCY_P95   LATENCY_P99   TCP_CONN
  backend          2/2   100.00%   67.8rps           1ms           1ms           1ms          8
  backend-bad      1/1     1.13%   35.3rps           1ms           1ms           1ms          4
  slow-cooker      1/1   100.00%    0.4rps           1ms           2ms           2ms          2
The per-deployment output tells you which pod is the problem, but it doesn't show the real impact on the client. To see what slow-cooker actually observes when calling backend-svc, check the status at the service level:
linkerd viz stat svc -n endpoint-demoThe success rate has dropped to 60%. The backend-bad deployment gets more than a third of the traffic because Linkerd tends to route traffic to the pods with the lowest latency, and the failing endpoint fails very, very quickly!
To remove the failing endpoint from the pool, apply circuit breaking annotations to the target service.
Configuring the consecutive failure policy
In Linkerd, endpoint-level circuit breaking is configured via annotations directly on the Kubernetes Service resource. Here's the updated Service manifest with the five failure accrual annotations:
apiVersion: v1
kind: Service
metadata:
  name: backend-svc
  namespace: endpoint-demo
  annotations:
    # 1. Break the circuit after too many consecutive failures
    balancer.linkerd.io/failure-accrual: "consecutive"
    # 2. Sets the threshold: 5 consecutive failures before ejection
    balancer.linkerd.io/failure-accrual-consecutive-max-failures: "5"
    # 3. Controls the duration (backoff)
    balancer.linkerd.io/failure-accrual-consecutive-min-penalty: "10s"
    balancer.linkerd.io/failure-accrual-consecutive-max-penalty: "5m"
    # 4. Adds jitter to prevent reconnection spikes
    balancer.linkerd.io/failure-accrual-consecutive-jitter-ratio: "0.2"
spec:
  selector:
    app: backend
  ports:
  - port: 8080
    targetPort: 8080
To apply:
kubectl annotate -n endpoint-demo svc/backend-svc \
  balancer.linkerd.io/failure-accrual=consecutive \
  balancer.linkerd.io/failure-accrual-consecutive-max-failures=5 \
  balancer.linkerd.io/failure-accrual-consecutive-min-penalty=10s \
  balancer.linkerd.io/failure-accrual-consecutive-max-penalty=5m \
  balancer.linkerd.io/failure-accrual-consecutive-jitter-ratio=0.2


service/backend-svc configured
The configured confirmation means the existing service was updated. The slow-cooker's proxy picks up the annotation change and immediately starts tracking consecutive failures per endpoint. No restart required.
What each parameter controls and how they interact
Understanding how these parameters interact is key to tuning circuit breaking for different workload profiles.
- failure-accrual: Set to "consecutive". Linkerd 2.20 also supports the "unified" policy for intermittent failures, but this article covers only consecutive.
- max-failures: The number of consecutive L7 (HTTP 5xx) or L4 (connection refused/timeout) errors required to eject the endpoint. With 5, a pod can fail 4 times, succeed once, and the counter resets. 5 failures in a row trigger ejection.
- min-penalty: The base duration the endpoint stays ejected before Linkerd sends a probation probe. With 10s, the pod is completely out of the routing table for at least 10 seconds.
- max-penalty: The ceiling for ejection time. If an endpoint fails its probation probe, the penalty doubles exponentially: 10s, 20s, 40s, up to max-penalty. This prevents the proxy from hammering a severely broken pod.
- jitter-ratio: If an entire tier becomes unstable, you don't want every endpoint to exit its penalty at the same millisecond, causing a thundering herd. A jitter-ratio of 0.2 on a 10s penalty randomizes the actual block to somewhere between 8 and 12 seconds.
How the circuit breaker recovers without manual intervention
Linkerd doesn't require manual intervention to reset the circuit.
Linkerd allows a single real client request to be routed to that endpoint, acting as a structured health probe (probation probe).
- If the request succeeds: The endpoint is considered healthy, the consecutive failure counter resets to zero, and the endpoint is fully reintegrated into the load balancing pool.
- If the request fails: The endpoint is immediately ejected again and the penalty timer doubles (capped at max-penalty).
This mechanism lets the service continuously test for recovery without exposing the majority of user traffic to errors.
The production gotcha
Configuring the annotations is the easy part. Operating this in production requires understanding a specific architectural nuance of Linkerd that regularly trips up engineers: "Ready" in Kubernetes doesn't necessarily mean active in Linkerd.
This happened to me during a real incident response. An alert fired for high latency, so I ran kubectl get pods -n endpoint-demo and saw this:
  NAME                       READY   STATUS    RESTARTS   AGE
  backend-6b87d55b96-abcde   2/2     Running   0          5h
  backend-6b87d55b96-fghij   2/2     Running   0          5h
  backend-6b87d55b96-klmno   2/2     Running   0          5h
All pods 2/2 Running. I assumed the infrastructure was healthy and spent nearly 40 minutes hunting a bug in the application code. Only when I ran
linkerd diagnostics proxy-metrics deploy/<client-pod> -n <namespace>I discovered that one endpoint was actively ejected by the Linkerd data plane. Linkerd had figured out that one pod was failing, while the kubelet had no idea.
That’s the value proposition of endpoint-level circuit breaking: it protects your users while you're still investigating. Your team does still need to know where to look when kubectl says everything is fine and errors keep coming in, though!
How to confirm Linkerd is ejecting the endpoint
Standard Kubernetes metrics won't tell you whether Linkerd is ejecting an endpoint. For that, you need to look at the metrics coming from the Linkerd proxy.
The metric that confirms ejection is outbound_http_balancer_endpoints, exposed by the client pod's proxy. It tracks the state of every endpoint in the proxy's outbound load balancing pool.
Pull the raw metrics directly from the slow-cooker proxy:
linkerd diagnostics proxy-metrics deploy/slow-cooker -n endpoint-demo | grep outbound_http_balancer_endpointsYou'll see two lines for backend-svc, one per state:
outbound_http_balancer_endpoints{endpoint_state="pending",parent_group="core",parent_kind="Service",parent_namespace="endpoint-demo",parent_name="backend-svc",parent_port="8080",parent_section_name="",backend_group="core",backend_kind="Service",backend_namespace="endpoint-demo",backend_name="backend-svc",backend_port="8080",backend_section_name=""} 1
outbound_http_balancer_endpoints{endpoint_state="ready",parent_group="core",parent_kind="Service",parent_namespace="endpoint-demo",parent_name="backend-svc",parent_port="8080",parent_section_name="",backend_group="core",backend_kind="Service",backend_namespace="endpoint-demo",backend_name="backend-svc",backend_port="8080",backend_section_name=""} 5
The metric that confirms that endpoints have been ejected is actually the first: we see endpoint_state=”pending” with a count greater than 0. This is the count of endpoints that have been shut down, and are waiting to become active again. (The endpoint_state=”ready” line is beyond the scope of this article, but the important bit is that its value does not correspond to the count of active pods! The simplest interpretation is that as long as it’s greater than zero, the service as a whole is live.)
To confirm at the service level, run linkerd viz stat svc -n endpoint-demo. The same command that showed 60% earlier now shows:
linkerd viz stat svc -n endpoint-demo
NAME          MESHED   SUCCESS        RPS   LATENCY_P50   LATENCY_P95   LATENCY_P99   TCP_CONN
backend-svc        -    99.98%   100.0rps           1ms           1ms           1ms          6
Success rate back to 99.98%, with the bad pod still present, still reported as 2/2 Running by Kubernetes, and still returning HTTP 500 on 100% of requests that reach it. Linkerd simply stopped sending real requests there.
Mastering Resilient Production Traffic
Kubernetes tells you your pods are healthy, but that is often only half the story. While the orchestrator ensures your containers are running, Linkerd tells you what is actually happening to your users' traffic in real time. In the complex reality of microservices, Kubernetes readiness probes and actual L7 traffic health are not always aligned. By implementing endpoint-level circuit breaking with Linkerd, you move beyond simple liveness checks to a proactive, traffic-aware resiliency model that isolates failures automatically.
FAQs
What is circuit breaking in Linkerd?
Circuit breaking in Linkerd stops sending traffic to individual pods that keep failing, while the rest of the service keeps handling requests. It's available in Linkerd 2.13 and later, in both open source Linkerd and Buoyant Enterprise for Linkerd (BEL).
Why doesn't Kubernetes stop routing traffic to a failing pod?
A pod can keep passing its kubelet readiness probe while failing almost every real request. Kubernetes reports it as Ready and keeps it in the Service's endpoint pool. Linkerd's proxy watches the actual responses, so it can eject that one endpoint.
How do you configure consecutive failure circuit breaking in Linkerd?
Add annotations to the Kubernetes Service. Set balancer.linkerd.io/failure-accrual to consecutive, then tune max-failures, min-penalty, max-penalty, and jitter-ratio. The client proxy picks up the change right away, with no restart required.
How does a Linkerd circuit breaker recover a failing endpoint?
After the penalty period, Linkerd routes 1 real request to the endpoint as a probation probe. If it succeeds, the failure counter resets and the pod rejoins the pool. If it fails, the pod is ejected again and the penalty doubles, up to max-penalty.
How can you tell if Linkerd is ejecting an endpoint?
Run linkerd diagnostics proxy-metrics against the client workload and grep for outbound_http_balancer_endpoints. A count above 0 on the endpoint_state="pending" line means endpoints are ejected. kubectl get pods will still show them as Running.